Download
1 / 60
600 likes | 779 Views
Scales of larval settlement in marine fishes and invertebrates. Elizabeth Madin and Robin Pelc November 5, 2004. Outline. Life history characteristics 2) Larval settlement correlations - spatial - temporal 3) Suggestions for future avenues. Life history characteristics: Matrix.

E N D
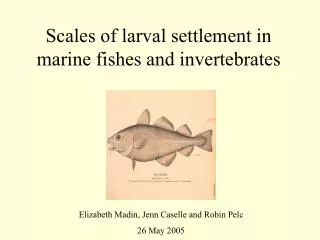
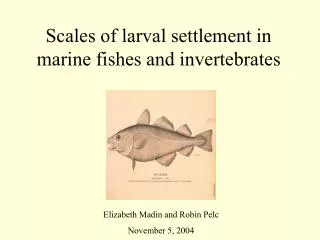
Scales of larval settlement in marine fishes and invertebrates Elizabeth Madin and Robin Pelc November 5, 2004
Outline • Life history characteristics 2) Larval settlement correlations - spatial - temporal 3) Suggestions for future avenues
Life history characteristics: Matrix • Natural mortality of adults (m) • Spawning season • Fecundity (# larvae/female) • Spawning character • Spawning cues/habitats • Larval PLD • Precompetency period • Competency period • Larval dispersal locations • Form(s) of density-dependence • Sources
Life history characteristics: Other data collected • Habitat • Reproductive mode • Duration of releases • Realized dispersal distance • Spatial scale of releases not sure these data exist for most species
Life History Characteristics: Rockfish ^^^ = peak fertilization *** = peak spawning PLD: generally ~1-3 mos.; Black: up to 180 days; Blue: up to 130 days Spawning type: most are viviparous or ovoviviparous
Life history characteristics: Cabezon • Habitat: demersal; hard bottoms • Reproduction: oviparous, males guard eggs • Spawning season: Dec–Jan (CA), Mar–Apr (WA) • Egg duration: 2-3 weeks • PLD: 3-4 mo. • Realized dispersal distance: unknown? • Spawning cues/drivers: unknown? • Duration of releases: spawns at least twice per season • Spatial scale of releases: unknown?
Life history characteristics: Kelp Bass • Habitat: benthopelagic • Spawning type: broadcast spawners • Spawning season: June-Sept./Oct. • PLD: 1 mo. • Competency period: 1-2 days • Realized dispersal distance: unknown? • Spawning cues/drivers: unknown? • Duration of releases: female produces eggs approx. continuously over spawning season • Spatial scale of releases: unknown? • Larval dispersal locations: near surface
Life history characteristics: Abalone (Haliotis rufescens) • Habitat: benthic • Spawning type: synchronous broadcast spawning, multiple times/year; non-feeding veligers • Spawning season: year-round (S. CA); Oct.-Feb. (N. CA) • PLD: 7-10 days (CA); 6-11 days (Aus.) • Realized dispersal distance: <15 m? • Spawning cues/drivers: metamorphosed conspecifics; corraline algae; bacterial films • Duration of releases: unknown? • Spatial scale of releases: unknown?
Life history characteristics: Abalone (Haliotis rufescens) • Natural mortality of adults (% die/year): m = 0.139 • Fecundity (#larvae/female): varies with size • Precompetency period: 7-10 days • Competency period: 2 hours - 2 weeks • Form(s) of density-dependence: unknown?
Life history characteristics: Lobster • Habitat: benthic; rocky reef and kelp forest to 240 feet depth. Berried females and juveniles found in shallow water (to 30 feet) • Spawning type: once yearly; females carry eggs • Spawning season: June – August (eggs released) • PLD: 5-9 months • Realized dispersal distance: unknown? • Spawning cues/drivers: unknown? • Duration of releases: unknown? • Spatial scale of releases: unknown?
Life history characteristics: Urchins • Habitat: benthic (mobile) • Spawning type: synchronous broadcast spawning • Spawning season: (central CA) Jan-May/July (S.purpuratus); Feb-July (S.franciscianus) • PLD: (CA) 66 days (S.purpuratus); 48 days(S.franciscianus) • Realized dispersal distance: unknown? • Spawning cues/drivers: chemical (assumed); photoperiod? • Duration of releases: unknown? • Spatial scale of releases: unknown?
Settlement decorrelation scales: Datasets • Datasets used: • PISCO SMURF (ongoing) Location: California Species: Pacific fishes; some invertebrates • Caffey (1985) Location: Australia (NSW) Species: barnacles (Tesseropora rosea) • Ebert, Schroeter, Dixon and Kalvass (1994) Location: California Species: urchins (Strongylocentrotus franciscanus and S. purpuratus) • Robertson (unpublished data) Location: Panama (San Blas) Species: Acanthurus bahianus • PISCO high frequency intertidal/mooring plates/tuffy (unpublished data) Location: Channel Islands (Prisoners and Valley) Species: intertidal invertebrates 6) Myers, Mertz and Bridson (1997) Location: global Species: 11 marine fish species
Settlement decorrelation scales: Datasets • Other potential datasets: • PISCO intertidal (ongoing) Location: Channel Islands Species: intertidal inverts • Gaylord and Morgan (unpublished data) Location: California Species: pier piling community (urchins; other intertidal inverts) • Gaines (unpublished data) Location: New England Species: intertidal inverts
Channel Islands SST over Time Hazards vs Pelican – evidence of lags in temperature pattern? Willow vs. Valley – patterns appear more similar
Settlement decorrelation scales: PISCO smurfs (CA) Raw data: (sample)
Settlement decorrelation scales: PISCO smurfs (CA) A. Rockfish (Kelp, Black, Gopher)
Settlement decorrelation scales: PISCO smurfs (CA) A. Rockfish (Kelp, Black, Gopher) B
Settlement decorrelation scales: PISCO smurfs (CA) A. Rockfish (Kelp, Black, Gopher) D
Settlement decorrelation scales: PISCO (CA) smurfs B. Rockfish (Yellowtail, Olive)
Settlement decorrelation scales: PISCO smurfs (CA) B. Rockfish (Yellowtail, Olive) A
Settlement decorrelation scales: PISCO smurfs (CA) C. Cabezon
Settlement decorrelation scales: PISCO smurfs (CA) C. Cabezon C B
Settlement decorrelation scales: PISCO smurfs (CA) C. Cabezon
Settlement decorrelation scales: PISCO smurfs (CA) D. Kelp Bass
Settlement decorrelation scales: PISCO smurfs (CA) D. Kelp Bass
Settlement decorrelation scales: PISCO smurfs (CA) Summary • Spatial decorrelation plots may inform the probability distribution (kernel) of larval dispersal in specific regions • Larval dispersal in the Channel Islands is determined in part by competing oceanographic intrusions
Decorrelation of Settlement - Cabezon 0.4 0.2 0 -0.2 -0.4 -0.6 -0.8 Settlement decorrelation scales: PISCO smurfs (CA) Decorrelation of Settlement - KGBs Decorrelation of Settlement - Yellowtail/Olive 1.2 1.2 1 1 0.8 0.8 0.6 0.6 0.4 0.4 Correl Correl 0.2 0.2 0 0 0 2 4 6 8 10 -0.2 0 2 4 6 8 10 -0.2 -0.4 -0.4 -0.6 Time lag – 2 week periods Time Lag – 2 week periods Decorrelation of Settlement - Kelp Bass 1.2 1.2 1 1 0.8 0.8 0.6 0.6 0.4 Correl Correl 0.2 0 0 2 4 6 8 10 0 2 4 6 8 10 -0.2 -0.4 -0.6 Time Lag – 2 week periods Time Lag – 2 week periods
PISCO intertidal (CA): Sites and Temperature Regime, SCI Figure 1. Map of the Southern California Bight and the California Channel Islands. The western part of the Santa Barbara Channel is under the influence of the large upwelling center located at Point Conception. The inset shows Santa Cruz Island and the location of the intertidal monitoring sites. Figure 2. Long-term mean (±1 SE) of sea surface temperature derived from 1-km resolution AVHRR satellite imagery between 1996 and 2002. Note the large thermal gradient between sites located less than 20 km apart. Figures from Broitman, Blanchette and Gaines, in press
PISCO intertidal (CA): Settlement Decorrelation Scales, SCI Figure 3. Mean temporal autocorrelation of the time series of all eastern (dashed lines) and western (solid lines) sites. The dotted line is the confidence interval for significant correlation corrected for the degrees of freedom at each time lag. Figure 4. (A) Spatial time series of log10-transformed larval recruitment rates around Santa Cruz Island between 1997 and 2000 for Chthamaloid barnacles, and (B) between 1996 and 2000 for Mytilid mussels. Figures from Broitman, Blanchette and Gaines, in press
Settlement decorrelation scales: Caffey (barnacles; Australia)
Settlement decorrelation scales: Caffey (barnacles; Australia) Spatial correlation of barnacle recruitment 1 0.8 0.6 0.4 2 R = 0.3879 Correl 0.2 0 0 100 200 300 400 500 600 -0.2 -0.4 Distance between sites (km) Red: Scott’s Head vs. other sites Green: Nobby’s Head, Green Point, and Cape Banks vs. Warden Head Blue: Nobby’s Head, Green Point and Cape Banks vs. Dolphin Point or Nundera Point Orange: Dolphin Point and Nundera Point vs. Warden Head
Settlement decorrelation scales: Caffey (barnacles; Australia)
Settlement decorrelation scales: Ebert et al. (urchins; California) D: Gaviota E: Ellwood Pier F: Stearn’s Wharf G: Dana Point H: Scripps Institute of Oceanography I: Ocean Beach
Settlement decorrelation scales: Ebert et al. (urchins; California) PLD: Purple = 66 days Red = 48 days
Settlement decorrelation scales: Ebert et al. (urchins; California) Spatial correlation of red urchin settlement 2 R = 0.1977 0.9 0.8 0.7 0.6 0.5 Correl 0.4 0.3 D: Gaviota E: Ellwood Pier F: Stearn’s Wharf G: Dana Point H: SIO I: Ocean Beach 0.2 0.1 0 0 50 100 150 200 250 300 350 Distance (km) Red: Ocean Beach (I) vs. other sites
Settlement decorrelation scales: Ebert et al. (urchins; California)
Recruitment decorrelation scales: rockfish in CA current John Field and Stephen Ralston. Spatial variability in California current rockfish recruitment events. Species: chilipepper, widow, yellowtail
Recruitment decorrelation scales of rockfish (Field and Ralston, in press) e-folding scale: 690 kilometers
Settlement decorrelation scales: Robertson Acanthurus bahianus (Panama)