Download
1 / 14
140 likes | 240 Views
Performance Budgeting and Results First – creating a strong state accountability system. Gary VanLandingham Director, Results First. The Pew Center on the States. The national picture. Most states have some type of budgeting for results system

E N D
Performance Budgeting and Results First – creating a strong state accountability system Gary VanLandingham Director, Results First
The national picture • Most states have some type of budgeting for results system • 33 have broad statutes mandating performance/results systems • Three enacted new performance/results laws in 2010 • Some have also created systems through executive action without statutory mandate
Objectives of state systems • Measure and report programs accomplishments • Compare successes and costs so that best and worst performing programs can be identified • Consider information in budget and policy decisions; cut poorly performing programs and direct funds to those with best return on investment
Success has been mixed • Many have developed reasonably strong performance reporting systems • Typically require agencies to report output and outcome measures • States have struggled to use performance information in the budget process
Lessons learned • It takes time to develop good performance reporting/budget systems • Data quality is important– need quality assurance checks on measures • Strong leadership is essential, ideally from both the governor and legislature • Measures must be useful for agencies, governor and legislature • Different measures reported to each level
Measures should be layered Policy measuresassess whether overall goals are achieved - report to policymakers POLICY (Vision) Measurement Detail Increases from Top to Bottom Program measuresassess whether key strategies are successful - report to executive management Bottom Measures Feed into Top Measures PROGRAM (Key interventions) Task measures assess lower-level activities – reported within agency TASKS (Frontline activities)
Lessons learned (cont’d) • Systems can help drive agency performance, if they take it seriously • Process of developing measures focuses attention on what agencies are trying to accomplish • Communication is critical – results should be reported via graphics and show trends(spreadsheets are deadly)
Lessons learned (cont’d) • Need to keep expectations reasonable – measures inform budget and policy choices, but politics still happens • It is hard to link results to funding (state accounting systems typically don’t track unit costs)
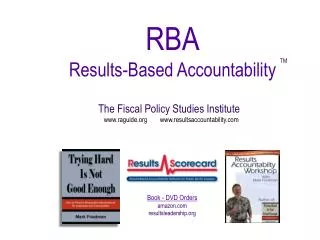
Cost benefit analysis could help • Cutting-edge cost-benefit analysis models are now available that analyze key policy areas • Enables states to analyze a wide range of policy choices and identify options that improve outcomes AND reduce costs • The models can be incorporated into budgeting for results system to help link outcomes to funding
Approach in a nutshell • Aggregate best national research to identify evidence-based programs that work • Apply research estimates of program impact to state population • Use state fiscal data to estimate total costs and benefits for each program • Predict return on investment for both individual programs and portfolios
Restorative Justice (low risk)-8.7% (21)$7,067 Reducing Crime: Some Findings Change In Crime Benefits less costs, per-person, life cycle (Probability: you lose $) Example model outputs Adult Offenders Cognitive-Behavioral Treatment-7% $12,037 (<1%) Adult Drug Courts-9% $6,264 (<1%) Prison Education -8% $13,555 (<1%) Drug Treatment in Prison -6% $9,588 (<1%) IST: surveillance-2% -$2,174 (≈82%) ISP: treatment-18% $15,079 (≈11%) Juvenile Offenders Functional Family Therapy -18% $32,021 (<1%) Multisystemic Therapy -13% $18,120 (<1%) Aggression Replacement -9% $15,257 (<1%) Family Transitions -10% $29,721 (≈5%) Therapeutic Foster Care -18% $64,486 (<1%) Prevention* Pre-School* (low income)-17% $+++* (n/a) Nurse Family Partnership*-16% $+++* (n/a) * Programs have a number of other non-crime benefits; only crime-reduction reported here. Why focus on juveniles if our focus is prison? 73% of adults in Washington’s prisons have been in Washington’s juvenile justice system
Policy areas in models • Criminal justice • K-12 education • Child welfare • Substance abuse • Mental health • Health • Public assistance • Housing • Teen birth
Results First • Provides models to state • Trains staff in using cost-benefit analysis • Provides technical assistance in getting the models up and running • Helps interpret results for policy makers • Compiles lessons learned and shares with participating states • Periodically updates models