Download
1 / 29
300 likes | 477 Views
Lesson 2: Designing and Conducting Investigations. Ex – from, out Milli – 1/1000 Centi – 1/100 Deci – 1/10 Deka – 10 Hecto – 100 Kilo – 1000 Thermo – heat Micro – small.

E N D
Lesson 2: Designing and Conducting Investigations Ex – from, out Milli – 1/1000 Centi – 1/100 Deci – 1/10 Deka – 10 Hecto – 100 Kilo – 1000 Thermo – heat Micro – small An investigation is not considered “scientific” if it is not conducted following specific rules ensuring that the information gathered is accurate, unbiased, and ethical.
Hypothesis = possible explanation or answer to a scientific question. Variable= anything that can affect the results of an experiment. Variable Variables Independent/manipulated = changed by you Dependent/responding = what is measured Experimental Design = steps that must be taken to conduct a test. EXAMINES ONLY ONE VARIABLE AT A TIME.
Tools of the Trade RULER LENGTH or DISTANCE Using the metric ruler to measure LENGTH: Smiley Face 4.7 cm OR 47 mm
TEMPERATURE Thermometer
VOLUME Graduated Cylinder Using graduated cylinders to measure VOLUME: meniscus 6.6 ml
6 0 grams MASS 2.4 Why is the largest mass on the middle arm? 0 62.4 grams Triple Beam Balance
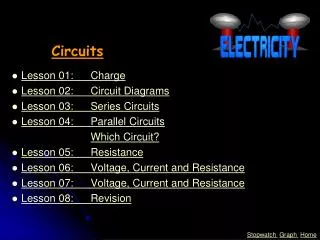
WEIGHT ORGANIZATION Calculator/Computer Spring Scale VIEWING DISTANT OBJECTS TIME Stopwatch Telescope
Microscope VIEWING SMALL OBJECTS Be able to identify all the parts of the microscope on Text pg 1070.
Measuring the Volume of an Object Water level after rock is added. 23 – 20 = 3 ml 23 ml Water level before rock is added. 20 ml Difference in the volume before and after equals the volume of the rock.
Derived Units = units that are made up of two or more other units. Density = m/v Speed = m/s Force (Newtons = m x kg/s2) Solid Volume = cm3
DENSITY = MASS/VOLUME REGULAR SHAPE IRREGULAR SHAPE Class activity: Finding the density of two objects.
For each shape: Get the mass using a triple beam balance. Irregular Shape = 373.3 grams RegularShape = 62.4 grams
For the REGULAR shape: Get the VOLUME using a METRIC RULER. VOLUME = 2.5 cm x 2.5 cm x3.0 cm Metric (cm) VOLUME = 18.75 cm 3 2 .5 cm 2 .5 cm OLD (inches) 3.0 cm VOLUME = L x W x H
For the IRREGULAR shape: Get the VOLUME using a GRADUATED CYLINDER. Volume = After - Before Volume = 90 - 75 Volume = 15 ml 90 ml 75 ml Before After
To get the DENSITY: DENSITY = MASS/VOLUME Irregular Object Regular Object Mass = 62.4 grams Mass = 373.3 grams Vol = 18.75 cm3 Vol = 15 ml D = 62.4 g / 18.75 cm3 D = 373.3 g / 15 ml D = 3.328 g/cm3 D = 24.9 g/ml
Example Procedure: Label two beakers. Add 100 ml water to each. Measure and add 10 g salt to one beaker. Stir to dissolve. Heat. Record the temperature when the water in each beaker boils. Variable is any factor that can affect the results. Variables in this experiment: Beaker sizes, amount of water, amount of salt, and heating method. SCIENTIFIC METHOD A series of organized steps that scientists use as a guide for solving a problem or answering a question. Misty wants to determine if water boils faster when salt is added. She believes water will boil faster if salt is added. Her hypothesis is “Salt water boils faster than unsalted water.”
Q. Suzanne wanted to test how light affects the growth of plants. She will measure the number of cm each plant grows. Which two groups should Suzanne use for her experiment? A. Suzanne should use Group A and B. 2. What variable is Suzanne testing? A. She is testing the Amount of light. Redi and Pasteur http://www.sumanasinc.com/webcontent/animations/content/scientificmethod.html
Experimental Design Control Group = group to which nothing is changed. Experimental Group = group to which something is changed. Example: Experiment in Coach book. Control Group = beaker with only water Experimental Group = beakers with salt added Variable being Tested = salt TEST ONLY 1 VARIABLE AT A TIME.
Independent variable = Dependent variable = Control Group = Conclusion = Salt Boiling Point 1 L water group Salt does increase the Boiling Point of water.
What prediction can you make based on these data? If 3 tbl salt are added to 1 L water, the boiling point will be higher than 103.4 C.
Scientists report their findings: • publish it in scientific magazines/journals • report it to other scientists • provide findings to the scientific community for scrutiny Common Ways to Present Information: • Chart/Table = summarizes data • Diagram/Model = explains or shows detail • Bar Graph = shows magnitude of data • Line Graph = relates two sets of data; shows how data changes • Circle Graph = relates parts of a whole • Flowchart = shows the order of steps • Scatter Plot = shows relationship between sets of data
Bias = a predisposition to a particular idea or conclusion. Examples: 1. A principal working to determine the most nutritious school menu would not get an unbiased response if he only asked 5 year olds. A congressman searching for information about the humane treatment of animals would not gather accurate data if she only asked animal rights activists. Scientists must guard against bias as they do their work. They must be careful that their sample is not biased and not to read their data with bias (seeing what they want to see instead of what is truly represented.
Sample= group of a population that is being studied. TOO SMALL GOOD SAMPLE SIZE POPULATION
The importance of controls… The scientist is studying the affects of fertilizer. Is this a good experimental set up? NO What is wrong with this experimental design? How can we change this to make it correct? Per day10 ml H2O 2 g fertilizer 3 hrs sunlight Per day15 ml H2O 5 g fertilizer 6 hrs sunlight Per day20 ml H2O 10 g fertilizer 4 hrs sunlight 10 10 0 3 3
DO IT NOW… Read “Alternative Interpretations of the Data” on Coach pg 58. Answer the Discussion Question at the bottom. When you finish, lay your pen/pencil down and sit quietly.
When a question involves a graph or other diagram, make sure you know what is being represented before you attempt to answer the questions. Always read the LABELS describing the graph axes and lines. TIPS TEST