Download
1 / 9
90 likes | 226 Views
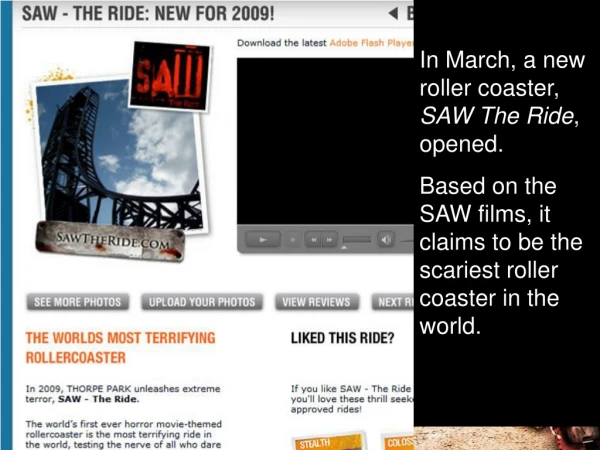
In March, a new roller coaster, SAW The Ride , opened. Based on the SAW films, it claims to be the scariest roller coaster in the world. The ride includes a 100ft 100 º drop, which results in passengers’ experiencing 4.7 times their normal body weight.

E N D
In March, a new roller coaster, SAW The Ride, opened. Based on the SAW films, it claims to be the scariest roller coaster in the world.
The ride includes a 100ft 100º drop, which results in passengers’ experiencing 4.7 times their normal body weight. Click here to watch the BBC video about the ride
Is it the scariest ride? There are faster rides, longer drops, more loops… The Kingda Ka roller coaster in New Jersey, USA, has a world record 418 ft drop. At 456 ft, it’s also the tallest roller coaster in the world and the fastest, achieving speeds of 128 mph.
Up2d8 mathsRockin’ Roller Teacher Notes
Rockin’ Roller Introduction: The new ‘beyond vertical’ roller coaster based on the SAW series of horror films has been described as the ‘world’s most terrifying’. This resource encourages students to compare statistics on different roller coasters and to justify whether they believe SAW – The Ride is the scariest roller coaster in the world. Content objectives: - use proportional reasoning to solve problems, choosing the correct numbers to take as 100%, or as a whole; interpret and use ratio in a range of contexts - design a survey or experiment to capture the necessary data from one or more sources; design, trial and if necessary, refine data collection sheets - review interpretations and results of a statistical enquiry on the basis of discussions; communicate these interpretations and results using selected tables, graphs and diagrams Process objectives: These will depend on the amount of freedom you allow your class with the activity. It might be worth considering how you’re going to deliver the activity and highlighting the processes that this will allow on the diagram below.
Activity:Students are introduced to SAW – The Ride and watch a video of the passengers. The idea of what makes a roller coaster scary is raised with statistics looking at the Kingda Ka in New Jersey, which is the highest and fastest roller coaster in the world. Students are then posed the question, ‘Which is the scariest roller coaster in the world?’ and are given data about: • the height • the drop • the speed • the length • the steepness and the number of inversions of world record-breaking roller coasters which they can compare to SAW - The Ride. The resource can be used in different ways depending on the curricular areas you want to cover. To work on proportional reasoning you might ask students to write a press release for SAW - The Ride stating how many times faster, higher or steeper it is than its competitors, or comparing it to familiar objects. Students could, for example, state how many times taller it is than a house (a ‘typical house’ is just over eight feet per storey plus six to eight feet for the roof) or a landmark such as Nelson’s Column? If you want to use the resource as a longer project which will allow students to work through the data handling cycle then you might ask them to use the statistics as a stimulus to find out what people are most/least scared of on roller coasters and to consider how these might be combined to create a ‘scary score’ for each roller coaster. The survey might, for example, find that people are more scared of inversions than the height and so a smaller rollercoaster with more inversions will have a higher score than a tall rollercoaster with fewer inversions. Students might then use this to rank some of the world record holders. Details about the roller coasters were taken from www.ultimaterollercoaster.com. Differentiation:You may decide to change the level of challenge for your group. To make the task easier you could consider: • adding scaffolding to the investigation, supplying or suggesting a table for collecting data or modelling how you might calculate how many storeys high SAW – The Ride is • offer a writing frame to help structure the report • suggest a structure for calculating how scary a particular ride is. You might decide that scariness is 60% inversions, 20% height and 20% speed and students could comment on the validity of this from their survey results. They could also use this to generate how scary each roller coaster is and to work out what balance would make SAW – The Ride the scariest in the world. To make the task more complex you could consider: • scaffolding less, asking the students to use the data to set and explore their own hypothesis about what makes a roller coaster scary • insisting that students use the data available and manipulate it to show conclusively that SAW – The Ride is the scariest roller coaster in the world • use the results of their statistical investigation to pitch for a new roller coaster which they could prove would be the scariest in the world and suggest features which this roller coaster should have. This resource is designed to be adapted to your requirements. Outcomes:You may want to consider what the outcome of the task will be and share this with students according to their ability. This task lends itself to a written report detailing both what the group found and how they found it. This might be presented as a poster or a longer written piece. You might also ask each group to present their findings to the rest of the class. Working in groups: This activity lends itself to paired or small group work and, by encouraging students to work collaboratively, it is likely that you will allow them access to more of the key processes than if they were to work individually. You will need to think about how your class will work on this task. Will they work in pairs, threes or larger groups? If pupils are not used to working in groups in mathematics, you may wish to spend some time talking about their rules and procedures to maximise the effectiveness and engagement of pupils in group work (You may wish to look at the SNS Pedagogy and practice pack Unit 10: Guidance for Groupwork). You may wish to encourage the groups to delegate different areas of responsibility to specific group members. Assessment:You may wish to consider how you will assess the task and how you will record your assessment. This could include developing the assessment criteria with your class. You might choose to focus on the content objectives or on the process objectives. You might decide that this activity lends itself to comment only marking or to student self-assessment. If you decide that the outcome is to be a presentation or a poster then you may find that this lends itself to peer assessment.
The first two slides introduce SAW – The Ride and the idea that it’s the scariest roller coaster in the world. The third slide introduces Kingda Ka, the highest and fastest rolle rcoaster in the world. The final slide poses the question ‘What is the scariest roller coaster in the world?’ and shows the data sheet with which the students will work. Probing questions:Initially students could brainstorm issues to consider. You may wish to introduce some points into the discussion which might include: • will everyone find the same thing scary? • which factors are most significant when deciding how scary a roller coaster is? • how will you combine these factors to the scariness of different roller coasters? • what sort of comparison makes a height seem greater (for example, http://sensibleunits.com suggests that 100 feet is the same as 9.5 male African elephants, 7 double-decker buses or 9.8 albatross wings – which of these would you use to make the rollercoaster seem higher?) • at 100° is the drop on SAW – The Ride ‘beyond vertical’? Is 100° more or less vertical than 80°? You will need: The PowerPoint display which you might read through with your class to set the scene at the beginning of the activity. There are just four slides:
Up2d8 mathsRockin’ RollerStudent resource sheets Click here to download the student resource sheets to accompany this Up2d8.