Download
1 / 28
280 likes | 425 Views
Design of Risk Management Strategies in Business Process Information Flow. Xue Bai Operations and Information Management School of Business University of Connecticut. Outline. Motivation and problem definition Methodology Experimental study Real world application Future research.

E N D
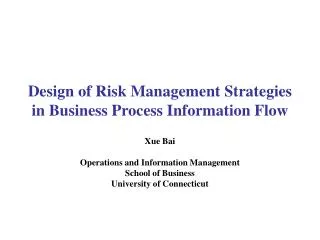
Design of Risk Management Strategies in Business Process Information Flow Xue Bai Operations and Information Management School of Business University of Connecticut
Outline • Motivation and problem definition • Methodology • Experimental study • Real world application • Future research Risk Workshop SAMSI
Motivation • Impact of errors in corporate business processes • “10 percent to 30 percent of the data flowing through corporate systems is bad…” (CFO magazine 2003) • Impact of errors in healthcare processes • More than 8.8 million ADE’s occur each year in ambulatory care, cost at least $5,000 per ADE. Medication errors account for 1 out of 131 ambulatory care deaths (Washington: eHealth Initiative 2004). • Health care data quality: accuracy 67%, completeness: 30.7% (Stein et al. 2000) • Legal mandates • Sarbanes Oxley Act (2002) • HIPAA(1996), Medical malpractice laws Risk Workshop SAMSI
An Example of BP with Errors and Risks An example: a medication process Call back and complain Wrong dosage Medication Pharmacist Prescription Call back and complain Formulary mismatch Prescription Adverse Drug Event Physician Patient Bill Call back and complain Bill Insurer Call back efforts; Administrative cost; Patient satisfaction & loyalty & litigation issues. Patient ends up in ER. Manual check Performance review E-prescribing systems E-order systems Bills for ER visit. Risk Workshop SAMSI
An Example of BP with Errors and Risks A medication process Medication Pharmacy Prescription Prescription Physician Patient Bill Bill Insurer Risk Workshop SAMSI
inaccurate dosage missing information check alertinfo. database update medication info. E-order mgt. Manual check Elements of the Model • A Business Process (BP) • Tasks • Information flow • Errors • Accuracy • Completeness • Occurrence • Risk exposure • Design of Control structure for risk management check alert info. database enter order info. enter order info. order update medication info. The order management process at the pharmacy Risk Workshop SAMSI
Outline • Motivation and problem definition • Methodology • Experimental study • Real world application • Future research Risk Workshop SAMSI
wrong dosage wrong dosage Process Structure Affects Error Impact A Simple Sequential Process Update medication information Update medication information Database Database Enter order information Check alert info. Enter order information Check alert info. Risk Workshop SAMSI
control control Process Structure Affects Control Function A Simple Parallel Process Order of medication Preparing voucher package Shipping invoice Payment voucher Risk Workshop SAMSI
t2 t1 t3 Theprecedencematrix: BP as a Graph Risk Workshop SAMSI
t2 t1 t3 t1:Non-Condition node: t1:Condition node: BP as a Graph Thevolume transitionmatrix:p(T): the ratio between the volume output by task i and the volume fed to task j, given tij =1. Risk Workshop SAMSI
t1:Non-condition node: t1:Condition node: Impact of Error • The propagation impact (PI)matrix: • K: the length of the longest path in a process. • p(T): the volume transition matrix • The propagation potential: Risk Workshop SAMSI
Error Generation • Error correlation structure • Models for error generation processes – hierarchical sampling schema • Controlling for dependence/independence due to the homogeneity/ heterogeneity of operations and resources involved • Within a task • Across tasks Risk Workshop SAMSI
Error Propagation • The number of errors of type m at task i: • : number of errors of type m that show up at task i • : number of errors of type m that arrive at task i • : occurrence of errors of type mgenerated by task i • : average number of eim Risk Workshop SAMSI
Loss and Risk Measurement • Loss: cim: cost of an error of type m at task i. • Risk Measures • Expected Loss (EL), Value-at-Risk (VaR), Conditional Value-at-Risk (CVaR) VaR EL CVaR β Risk Workshop SAMSI loss
VaR EL CVaR β loss Risk Measures • Expected Loss • Value-at-Risk • Conditional Value-at-Risk Risk Workshop SAMSI
Risk Management: Control Model • Control allocation factor • Effectiveness of control • the probability of a control catching an error: • Deterministic control • Stochastic control • Cost of control (per period) Risk Workshop SAMSI
Model Formulation I, II, and III • Design problem: Given a budget B, • Model I: “Expected-Loss-Optimal” Control Structure • Model II: “β-VaR-Optimal” Control Structure • Model III: “β-CVaR-Optimal” Control Structure Risk Workshop SAMSI
Outline • Motivation and problem definition • Methodology • Experimental study • Real world application • Future research Risk Workshop SAMSI
Experimental Study • Experimental design • Topological variation • Sequential, parallel, arbitrary • Process size • Small (4 tasks), medium (10 tasks), large (25 tasks) • Cost of control vs. Loss per error ( ) • Expensive: (500, 1000, 2000, 4000, 10000), inexpensive: (25, 50, 100) • Tolerance level of risks (β) • β = 0.90, 0.95, 0.99 • Error correlation • Independent, dependent Risk Workshop SAMSI
Experimental Results • As the process size increases, (Table 113, 115, 117, 119, 121, and 123) • The optimal amount of control allocation in total increases • The optimal amount of control allocation at each task decreases • For sequential structure, the objective function value increases exponentially; for parallel structure, the magnitude remains the same. • As the tolerancelevel of risks (β) changes (Table 2 and 10; Table 22 and 30), • The optimal amount of control allocation in total increases • The impact of βat the task leveldepends on characteristics of the loss distributions • In the range of βvalue and loss distributions tested, the impact is insignificant. • As the ratio cost of control / loss per error ( ) increases (Table 153-159) • The optimal amount of control allocation at each task decreases • The optimal amount of control allocation in total decreases Risk Workshop SAMSI
Experimental Results (continue) • Optimal control allocations depend on risk objectives. • The relative importance of each task location changes accordingly • Tradeoffs when consider multi-risk objectives • For processes with sequential structure, holding other factors constant, • The highest control allocations occur at tasks towards the center of the process. • For processes with parallel structure, holding other factors constant, • The highest control allocations occur at the merging tasks of the process. Risk Workshop SAMSI
Outline • Motivation and problem definition • Methodology • Experimental study • Real world application • Future research Risk Workshop SAMSI
Case Study • An Order Fulfillment Process The Data: 15 tasks, 13 internal tasks, 46 errors that occur in different tasks, costs per error per type, frequencies of error occurrences, cost factors of controls, based 1200 orders per month. Risk Workshop SAMSI
Results: Optimal Allocation of Control Resource The tasks: 0) Clients place order, 1) Enter order information, 2)Check payer and insurance info. 3) Create/update contracts, 4) Prove prescription, 5)Prepare prescribed items, 6) Dispense from alternative source, 7) Submit drug orders to wholesaler, 8) Deliver medication, 9) Prepare and send claims to an insurance company or 10) to the responsible party, 11) Collect payments, 12) Post payments and prepare vouchers, 13) Update ledgers, 14)insurer/clients pay bills. Risk Workshop SAMSI
Results: Optimal Objective Function Values The tasks: 0) Clients place order, 1) Enter order information, 2) Check payer and insurance info. 3) Create/update contracts, 4) Prove prescription, 5) Prepare prescribed items, 6) Dispense from alternative source, 7) Submit drug orders to wholesaler, 8) Deliver medication, 9) Prepare and send claims to an insurance company or 10) to the responsible party, 11) Collect payments, 12) Post payments and prepare vouchers, 13) Update ledgers, 14) insurer/clients pay bills. Risk Workshop SAMSI
Outline • Motivation and problem definition • Methodology • Experimental study • Real world application • Future research Risk Workshop SAMSI
Future research • Summary • Risk management models for error associated risks in business process information flow • Future research • Sensitivity analysis of the effect of other factors on optimal control allocations and risk objectives • Loss per error, Control effectiveness, Cost structure of controls, Topological redesign, Analytic solution for CVaR • Managerial problems • Multi-Objective Optimization • Find the maximum confidence level β for a given value-at-risk • Given the output errors, identify the most probable error sources • Many others. Risk Workshop SAMSI