Download
1 / 25
250 likes | 378 Views
Renewable Energy Generation – A Local Perspective –. National League of Cities – EENR Committee September 5, 2014. 2. Local/Regional Governance. Platte River Board of Directors. Estes Park. Fort Collins. Longmont. Loveland. Mayor Bill Pinkham Mr. Reuben Bergsten.

E N D
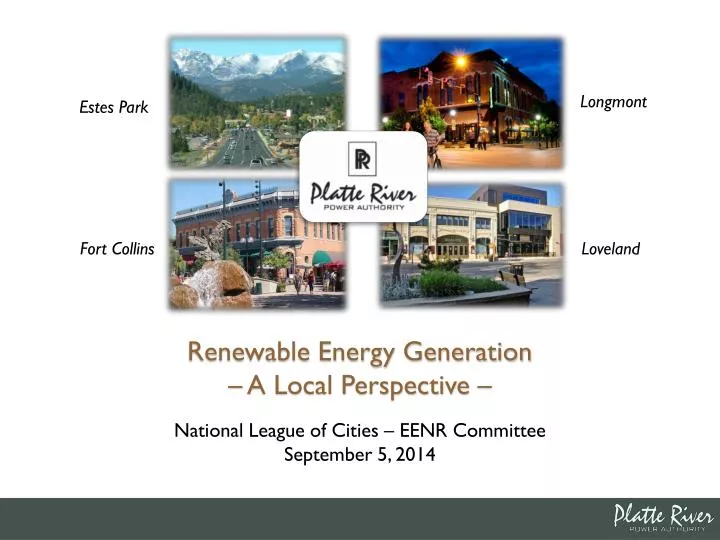
Renewable Energy Generation – A Local Perspective – National League of Cities – EENR Committee September 5, 2014
Local/Regional Governance Platte River Board of Directors Estes Park Fort Collins Longmont Loveland Mayor Bill Pinkham Mr. Reuben Bergsten Mayor Karen Weitkunat Mr. Gerry Horak Mayor Dennis Coombs Mr. Tom Roiniotis Mayor Cecil Gutierrez Mr. Steve Adams 3
Local Electric System Partnership Changing Boundaries Residential Small Business Generation Transmission Distribution Large Business Estes Park Fort Collins Longmont Loveland • Platte River Power Authority • Not for profit • Joint Ownership • Wholesale Market Participant Customers 4
Technology Evolution Price Growth NREL 5
Existing Wholesale Generation Resources 5 Rawhide Coal Hydropower (multiple sites) Craig Coal Rawhide Gas Turbines (simple cycle) Wind (multiple sites) 6
Demand Side Management Resources • About 5% system energy savings • to date (all measured programs) • Low cost vs. generation Energy Savings (MWh) Investment (millions) http://efficiencyworks.CO 7
Availability Comparison • Integration needed to • maintain reliability • Existing technology (short term) • New technology (long term) 8
Renewable Energy Source Trends • No Federal RES (yet) • State standards influence planning • CO – most hydro “not renewable” Close to 30% renewables (average water) Platte River System 60 MW wind & 30 MW solar planned (2014/2015) First Utility Scale Wind in Region 9
Regional Wind Resources • Lessons: • Economy of scale (significant) • Geographic diversity (limited for these sites) • Incentives favor taxable entities • Operation & maintenance cost escalation • Maintenance provider quality (outsource?) • Transmission constraints • Market timing – monitor trends Medicine Bow Spring Canyon Silver Sage Additional purchases from KS and OK 10
Wind Operations Considerations Wind output at system peak hour • Low availability during peak periods • Lower production in summer season than winter (summer peaking system) • Average generation rate of ~ 35% (capacity factor) • Newer generation ~ 40% + • Intermittent supply • Forecasting challenges • Requires balancing and regulation • Need new integration resource(s): • – Regional purchase (balancing authority) • – Local system utility scale (wholesale) • – Local distributed scale (retail) 12
2014 Solar RFP • Many years of study/estimates • Seeking firm price bids • 30 MW maximum size (Phase I) • Pricing for range of sizes (5–30 MW) • Photovoltaic technology • Fixed and tracking mountings • Degradation/output warranties • Lots of other details • Sale to all Municipalities • RFP released in late September 13
Siting Considerations • Large area needed • (5 to 10 acres per MW) • Land use/permitting requirements • Transmission cost can be avoided • Local interconnection limits 14
Distributed Solar • Municipal Solar Programs: • Focused on photovoltaic (PV) • Feed-in tariff design ~ 5 MW • Other programs ~ 3 MW • Office Complex System: • Still running after 27 years • Supported CSU students and research projects over time • Charged fleet electric vehicles 15 15
Solar Hot Water • “THERMAL” SOLAR SYSTEMS • Still an option! • Many local dealers • Tax credits available (thru 2016) • Homes & businesses • Support many of the same goals as electric systems • Some Municipalities provide natural gas service • Part of overall energy system RBI Solar 16
Distributed Renewable Energy • Existing – all four communities • ~ 420 systems (electric) • Total of about 3 MW (3,000 kW) • Largest = 180 kW • Smallest = 0.7 kW • Six small wind turbines/rest are PV solar • New programs adding more systems • Significantly higher cost than large scale • Can provide other “local” value 17
Solar Generation at Time of Peak • Intermittent supply • Higher in summer • ~ 18% capacity factor • Fast drop off • Need new integration resource Solar Peak (noon) Average July Day Output System Peak (typically 4-6 pm) Hours in a day 18
Solar “Duck Curve” SMUD (California) 19
Renewable Resource Integration OptionNatural Gas – Combined Cycle • Other Options: • Distributed generation (firm) • Storage technology? • Demand response? • Considerations • Improved efficiency • Lower emissions • Flexible modes – • simple cycle or combined cycle • Optional configurations • Variable operation to integrate intermittent renewable sources • Added costs Example – General Electric 20 34
Micro and Macro Integration Up to the Western Grid (Energy Imbalance Markets) Down to the Home (Micro Grids) ReBus • Renewables integration at every level • Complex system planning • Coordination/collaboration needed • Stakeholder communications critical PacifiCorp 21
Costs for New Resource Options U.S. average – Energy Information Administration 2013 http://www.eia.gov/forecasts/aeo/er/pdf/electricity_generation.pdf 22
Local CostComparisons • Key Points: • Does not include CO2 charges/other external costs • Federal incentives ~ 30-40% of renewable cost (included) • Size has significant impact on cost • Transmission and integration costs ~ 30% for wind • Costs are very site specific • Renewable costs dropping (solar more so than wind) • Costs of other resources increasing (capital, fuel + O&M) • Renewable value increasing • Net metering – cost recovery considerations PRELIMINARY 23
Planning for the Future • 2014 Strategic Plan • 2012 Integrated Resource Plan • 2009 Climate Action Plan • (Click on “Plans” tab) http://www.prpa.org/ • Key Initiatives: • Collaboration & Communication • Resource Portfolio Diversification • Technological Innovation • Safety • Exceptional Customer Service • Operational Excellence • Compliance Assurance • Financial Stability • Employee Engagement 24