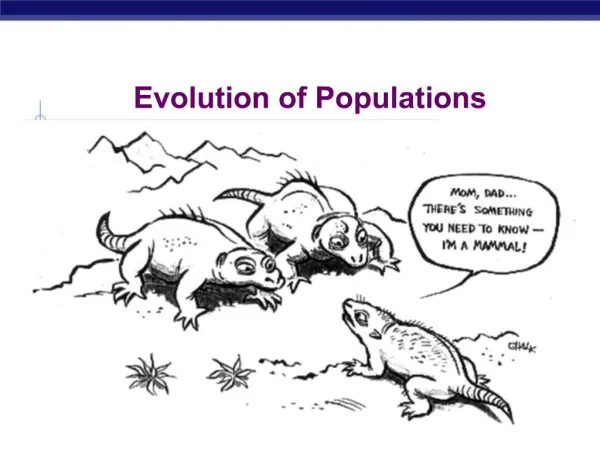
How Populations Evolve
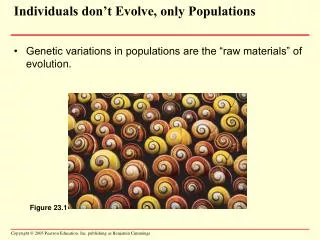
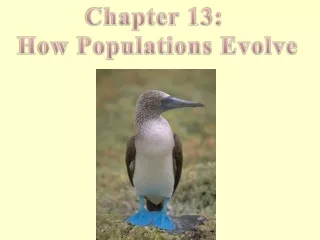
How Populations Evolve. Chapter 13 Part II. Biogeography – Australia is home to many unique plants and animals, such as marsupials, mammals that evolved in isolation from other continents where placental mammals diversified. Figure 13.10. Comparative Anatomy.

How Populations Evolve
E N D
Presentation Transcript
How Populations Evolve Chapter 13 Part II
Biogeography – Australia is home to many unique plants and animals, such as marsupials, mammals that evolved in isolation from other continents where placental mammals diversified Figure 13.10
Comparative Anatomy • Comparison of body structures between different species - confirms that evolution is a remodeling process in which - ancestral structures that functioned in one capacity become modified as they take on new functions or - descent with modification • Homology – the similarity in structures due to common ancestry - forelimbs of diverse mammals are homologous structures - same skeletal elements make up the forelimbs of humans, cats, whales, and bats - vestigial organs, remnants of structures that served important functions in the organism’s ancestors
Homologous structures: anatomical signs of descent with modification • Forelimbs of all mammals are constructed by the same homologous bones • Hypothesis that all mammals descended from a common ancestor predicts that their forelimbs, though diversely adapted, would be variations on a common anatomical theme Fig 13.11
Comparative Embryology • Comparison of anatomical structures that appear during the early stages of development - all vertebrates evolved from a common ancestor - embryos of fishes, frogs, snakes, birds, apes, humans look more alike - gill pouches develop into gills in fishes but in humans become parts of the ear and throat
Molecular Biology • Evolutionary relationships among species - hereditary background is documented in its DNA and proteins - 2 species with closely matched genes and proteins must have evolved from the same ancestor • Darwin’s boldest claim was that all forms of life are related to some extent - 100 years after molecular biology has provided strong evidence: all forms of life use DNA and RNA and the genetic code
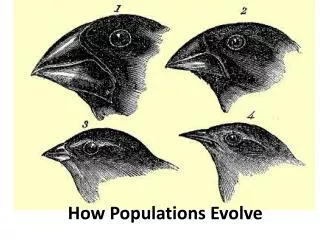
Natural Selection • Darwin perceived adaptation to the environment and the origin of new species as closely related processes - over time populations may diverge more and more in appearance - each population adapts to its local environment - Darwin’s finches that strayed from the SA mainland and diversified on different islands - an excellent example of natural selection and adaptive evolution
Galápagos finches with beaks adapted for specific diets Has a large beak specialized for cracking seeds that fall from plants to the ground The long narrow beak allows it to hold tools such as cactus spines to probe for termites and other wood-boring insects The smaller beak of the small tree finch is used to grasp insects Figure 13.14
Darwin’s Theory of Natural Selection • Darwin arrived at the conclusion that defines natural selection: - individuals whose inherited traits are best suited to the local environment are more likely than less fit individuals to survive and reproduce - based on two key observations • Observation 1: Overproduction - all species tend to produce many more offspring than the environment can support - overproduction and limited resources leads to a struggle for existence among the individuals of a population
Overproduction of Offspring • Millions of spores explode from these puffballs (2cm fungus) • The wind disperses the spores far and wide • Each spore, if it lands in a suitable environment, has potential to grow and develop into a new fungus • Only a tiny fraction of the spores will survive Figure 13.15
Observation 2: Individual Variation - much of the variation that exists among individuals in a population is heritable (siblings share more traits) - individuals in a population vary in many inheritable ways Inference: Differential reproductive success(natural selection) – those individuals with traits best suited to the local environment generally leave a larger share of surviving, fertile offspring
Color variations in a population of lady bugs Figure 13.16
Natural Selection in Action • Natural selection and evolution are observable phenomena • Examples of natural selection include: - pesticide resistance in insects. - development of antibiotic-resistant bacteria - drug-resistant strains of HIV
These examples highlight 2 key points: - first, natural selection is more of an editing process than a creative mechanism - second, natural selection depends on time and place: favors those characteristics in a varying population that fit the current local environment
The Process of Science: Does Predation Drive the Evolution of Lizard Horn Length? • One recent and elegant example of natural selection in action - the flat-tailed horned lizard - main predator, birds called shrikes, attack by biting the lizard’s neck behind the skull • Kevin Young and colleagues at Utah State and Indiana University made the observation - that the lizards defend against attack by thrusting their heads backward, stabbing the shrike
A flat-tailed horned lizard – uses the spiky horns that protrude from the back and side of the skull to ward off attacks Figure 13.17a
Designed a simple experiment: • Question – does longer horn length represent a survival advantage • Hypothesis – yes it did • Prediction – live horned lizards will have longer horns than dead ones • Experiment – measured length of horns from 59 dead lizards and 155 live horns • Results – average horn length of live lizards is about 10% longer than that of dead lizards • Conclusion – defensive behavior against predators is one factor driving natural selection of horn length
A shrike often impales the lizard on a fence or branch • Researchers measured the horns of impaled lizards and compared them with the horns of live lizards - significantly longer horns on live lizards suggests that horn length is an adaptation that is evolving in response to predation Fig 13.17b, c
The Modern Synthesis: Darwinism Meets Genetics • Darwin and Mendel lived and worked at the same time - natural selection requires hereditary processes that Darwin could not explain - by breeding peas Mendel illuminated the hereditary process required for natural selection to work - Darwinism and Mendelism came together in the mid-1900s, decades after both scientists had died • This fusion of genetics with evolutionary biology came to be known as the modern synthesis
Populations as the Units of Evolution • Biological definition: - a population is a group of individuals of the same species living in the same place at the same time - organisms of a population are more likely to breed with other locals therefore - organisms of a population are more closely related to one another than to members of other populations • A population is the smallest biological unit that can evolve - measure evolution by change over a span of generations
Populations a) 2 dense pop. of trees - separated by a lake but are not totally isolated. Interbreeding occurs when wind blows pollen between the populations. Nevertheless, trees are more likely to breed with members of the same population than with trees on the other side of the lake b) Satellite view of NA shows the lights of human population centers, or cities. People move around the country, of course, and there are suburban and rural communities between cities, but people are more likely to choose mates locally Fig 13.18
Population genetics – tracks the genetic makeup of populations over time - focuses on populations as the evolutionary units
Genetic Variation in Populations • Individual variation abounds in populations in all species that reproduce sexually - most populations have variations that can be detected only by biochemical means • Not all of this variation is heritable - phenotype results from a combination of the genotype, which is inherited, and many environmental influences - only the genetic component of variation is relevant to natural selection
Many variable traits result from the combined effect of several genes - polygenic inheritance produces traits that vary more or less continuously • A population is said to be polymorphic for a characteristic if two or more morphs, or forms, are present in noticeable numbers - features such as the ABO blood group, that are determined by a single gene locus
Polymorphism in a garter snake population – these 4 garter snakes of the same species were all captured in one field • The behavior of each morph (form) is correlated with its coloration. Spotted snakes, blend in with their environment, freeze when approached. Striped snakes, which make it difficult to judge the speed of motion, flee when approached Figure 13.19
Sources of Genetic Variation • Mutations and sexual recombination – both random processes produce genetic variation - a random mutation on rare occasions may enhance reproductive success - is more likely when the environment is changing in such a way that alleles that were once disadvantageous are favorable under the new conditions • Organisms with very short generation spans can evolve rapidly - with mutations as the only source of genetic variation
Most animals and plants with long generation times - prevent new mutations from affecting overall genetic variation in the short term - depend mainly on sexual recombination for the genetic variation that makes adaptation possible • The 2 sexual processes of meiosis and random fertilization - shuffle alleles to offspring in fresh combinations • Natural selection is not random, the environment selectively promotes - the propagation of genetic combinations that enhance survival and reproductive success
Analyzing Gene Pools • Key concept of population genetics is the gene pool – reservoir of genes for the next generation - consists of all alleles in a population at any one time • Alleles in a gene pool – occur in certain frequencies - can be symbolized by p for the relative frequency of the dominant allele in the population and - q for the frequency of the recessive allele in the population
Genotype frequencies can be calculated from allele frequencies - symbolized by the expressions p2, 2pg, and q2 • Hardy-Weinberg formula (1908) for calculating the frequencies of genotypes in a gene pool from the frequencies of alleles p2 + 2pg +q2 = 1 frequency of frequency offrequency of homozygous heterozygotes homozygous dominants recessives
Population Genetics and Health Science • The Hardy-Weinberg formula can be used to calculate the percentage of a human population that carries the allele for a particular inherited disease such as phenylketonuria (PKU) - inherited inablility to break down the amino acid phenylalanine - due to a recessive allele - untreated causes severe mental retardation - occurs in about 1:10,000 babies born in the US - frequency of 1:10,000, q2 = 0.0001
- so q, the frequency of the recessive allele = the square root of 0.0001 or 0.01 - and p, frequency of the dominant allele is 1-q or 0.99 - pq, frequency of the heterozygote is 2 X 0.99 X 0.01 or 0.0198 - in other words about 2% of the US population are carriers
A warning to individuals with PKU – frequency of the PKU allele is high enough to warrant a public health program that includes warnings on foods that contain phenylalanine Figure 13.21
Microevolution as Change in a Gene Pool • How can we tell if a population is evolving? - how can we measure changes in the genetic compostion of a population over time • Hardy-Weinberg equilibrium – describes a nonevolving population that is in genetic equilibrium - from generation to generation the frequency of alleles are unchanged - sexual shuffling of genes cannot by itself change a large gene pool - but natural selection can
Wildflower population – arrival of an insect that is attracted to white flowers - could enhance the reproductive success by pollinating more of the white-flowered plants - over generations, the selection factor would increase the frequency of the r allele (q ) • Evolution based on population genetics: Microevolution is defined as a generation-to-generation change in a population’s frequencies of alleles
Mechanisms of Microevolution • The main causes of microevolution are: - Genetic drift - Gene flow - Mutations - Natural selection
Genetic Drift • Flip a coin – heads or tails, 50% probability of either - flip a coin 1000 times and an outcome of 700 heads to 300 tails would be suspicious - flip a coin 10 times and an outcome of 7 to 3 would seem within reason (sampling error) • Same applies to a population’s gene pool - if a new generation draws its alleles at random from the previous generation, then the larger the population, - the better the new generation will represent the gene pool of the previous generation
Genetic drift - a change in the gene pool of a small population due to chance - the smaller the sample size the greater the chance of deviation from an idealized result • Wildflower population - in a small population chance causes the frequencies of the alleles for R and r flowers to change over the generations
Fig 13.22 • Small wildflower population with a stable size of 10 • Generation 1, only 5 plants produce fertile offspring • Generation 2 only 2 plants produce fertile offspring • Generation 3, over the generations, genetic drift can completely eliminate some alleles
The Bottleneck Effect • Is an example of genetic drift – results from a drastic reduction in population size - disasters such as earthquakes, floods, and fires may kill large numbers of individuals - by chance certain alleles may be overrepresented among the survivors - some may be underrepresented - some may be eliminated altogether • Bottlenecking usually reduces the overall genetic variability in a population because at least - some alleles may be lost from the gene pool - can be critical in endangered species as in the cheetah
The Founder Effect • Is genetic drift when a few individuals colonize an isolated habitat - the smaller the colony, the less its genetic makeup will match the gene pool of the larger population from which the colonists emigrated - establishment of a new population whose gene pool differs from the parent population and the subsequent genetic drift in the new colony is the founder effect
Genetic Drift and Hereditary Disorders in Human Populations • The founder effect explains the relatively high frequency of certain inherited disorders - in some human populations established by small numbers of colonists • British colony on Tristan da Cunha - one of the colonist carried a recessive allele for retinitis pigmentosa, a progressive form of blindness
Figure 13.25 • 1900s, residents of Tristan da Cunha, located in the middle of the Atlantic Ocean – world’s most remote island • Genetic isolation resulted in a high rate of hereditary blindness
Gene Flow • Another source of evolutionary change – genetic exchange with another population - a population may gain or lose alleles when fertile individuals move into or out of a population - or when gametes (plant pollen) are transferred between populations - tends to reduce genetic differences between populations