Download
1 / 15
150 likes | 258 Views
Learn about chromatic images, RGB color space, and mapping of induced charge density to color distribution. Explore charge variations relative to sphere radius and visualize charge locations. Discover the impact of additional point charges and distance changes on the metallic sphere's behavior.

E N D
What is a chromatic image supposed to be ? M ×N A colorized image is a matrix which has a dimension of 3 ×M ×N , and the index of which represents corresponding pixel. Each M ×N matrix is supposed to be a color element matrix of the image in RGB color space.
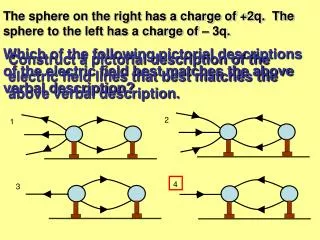
RGB color space A specified color has three elements: ZR (0,1) ZG (0,1) ZB (0,1) To illustrate the density of charge by color, we have to define a spectrum of these colors first.
There are many ways to make a color band. I only choose one plane (ZR-ZB) of RGB color space to define my spectrum.
How to convert induced charge density to color distribution ? The simplest way is to find a linearrelation between them. Then I get that k must be the maximum of σ.
How will R/d change the relative density ? R/d varying in the scope of (0.1,0.9) and θ∈(-Pi , Pi).
What dose it look like in the mapping plane? x-y y-z R/d=0.1 R/d=0.3 R/d=0.7
What about the condition near the limit point ? R/d=0.9 R/d=0.99 Those induced charges just appears locating on one point.
Let’s do something more interesting! How about adding another two point charges outside the metallic sphere? R/d=0.4
How about adding two negative point charges outside the metallic sphere? R/d=0.4
How about just changing the distance of the point charge outside the metallic sphere? R/d=0.3 R/d=0.7
Y-Z Finally, here are two interesting graphs mapped in y-z plane. Can you guess how the point charges locate?
Thanks for your attention! It is wrong but gorgeous anyway.