Download
1 / 22
220 likes | 363 Views
Bell, E. F et al. 2004 “Nearly 5000 distant Early-type galaxies in COMBO-17: A Red Sequence and its evolution since z~1” Presented by: Robert Lindner (Bob) . 1. Max Planck Gesellschaft/ESO 2.2m telescope at La Silla, Chile. 2. Wide-Field Imager (WFI) . 3. Data.

E N D
Bell, E. F et al. 2004“Nearly 5000 distant Early-type galaxies in COMBO-17: A Red Sequence and its evolution since z~1” Presented by: Robert Lindner (Bob) 1
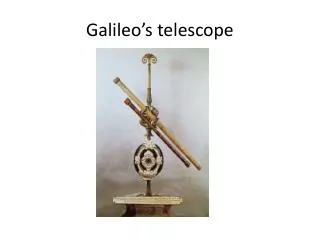
Max Planck Gesellschaft/ESO 2.2m telescope at La Silla, Chile 2
Data • 160ks of integration time per 30'x30' field split among 17 filters yields ~ 25000 galaxies. • ~5000 of these are Red Sequence galaxies UBV RI 4
Chandra Deep Field South Data 30'x30' 1'x1' zoom Max-Planck-Institut für Astronomie 5
Photometric Redshifts • Too many galaxies to measure spectroscopic redshifts for each! • Can be based on empirical local universe SEDs, or models. COMBO -17 data is based on models. • Errors in z propagate to every other calculated quantity! Sample is limited at z ~1.4 because of incomplete models at high redshift. 6
FIT! Photometric Redshifts Model Redshift 0.0 .1 .2 .3 .4 .5 .6 .7 .8 .9 1 F(λ) 17 Band Data Galaxy Template λ 7
K Correction • We measure the redshifted apparent magnitudes, and we want rest frame absolute magnitudes. • Using the apparent magnitudes, and the best fit z, and the assumed SED, you can recover the rest frame absolute magnitudes. They quote final uncertainties around .2 magnitudes. 8
K Correction Band Pass S S' 9
What did they find ? • The Distribution of galaxies in the color-magnitude diagram is bimodal out to redshift~1. • The rest frame U-V colors of the Blue and Red Sequence become redder with time. • The Blue and Red Sequence Galaxies have a well defined rest frame Color Magnitude Relation (CMR). 10
Reduced Chi-Squared and Q of straight line of <U-V> = 1.2 Χ2/ν = .088 Q~.75 They have over estimated their error bars! Χ2/ν = .011 for their models Q~.99 Evolution of the Red Sequence 14
“The thrust of this work is not therefore to argue the merits of the stochastic model, but only the merits of the expression as a good approximation to the luminosity function.” Paul Schechter, 1975 The Schechter Function 15
SDSS EDR galaxy luminosity function. Φ* =(10.2±0.9) 10-3 h3 Mpc-3mag-1 Overall Normalization MB* -5logh =-(19.16±0.1) Magnitude at the “Knee” α=-0.6 Power Law slope at faint limit The Schechter Function example 16
Evolution of the Luminosity Function MB* and Φ* Vary with z, α is kept constant at the local universe value 18
MB* Φ* Final Results:Characteristic Magnitude fits passive evolution model,Normalization does not. 19
jB Final Results:Luminosity Density is not consistent with passive evolution model Bumpy gray line is prediction of semi-analytic hierarchical galaxy formation model by Cole et al. 2000 20
Conclusions • Data supports hierarchical galaxy formation for two main reasons. • 1.) The luminosity density of this galaxy population as a function of redshift is inconsistent with the model of passive galaxy evolution. These results imply a factor of ~2 increase in mass to make up for the lack of fading. • 2.) There are very few blue sequence galaxies bright enough to age onto the most luminous red sequence galaxies. This might imply that the brightest red sequence galaxies were formed via mergers, not passive evolution. 21
Cole, S., Lacey, C., Baugh, C. M., & Frenk, C. S. 2000, MNRAS, 319, 168 Schechter, P., 1976, Astrophys. J., Vol. 203, p. 297 - 306 References Finish!