Robust Statistics for Improved Signal Interpretation: A Novel Pre-Tracking Alignment Approach
170 likes | 252 Views
This analysis focuses on the application of non-Gaussian statistics in physics to address noisy and dirty signals using robust statistical methods. It explores the benefits of robust statistical tools like Huber, Tukey, and Hampel in improving signal interpretation and alignment processes. The study demonstrates how deviations from the mean in data analysis can provide more accurate results, especially in scenarios with heavy-tail distributions or outliers. The implementation of robust statistics also aids in tasks such as correlation detection, line guessing, and regression, offering solutions for complex data fitting problems. The research proposes a new pre-tracking alignment concept that removes the need for tracking, presenting promising outcomes despite the ongoing work required for refinement. Ultimately, the study advocates for the adoption of robust statistical techniques to enhance data analysis in challenging environments.

Robust Statistics for Improved Signal Interpretation: A Novel Pre-Tracking Alignment Approach
E N D
Presentation Transcript
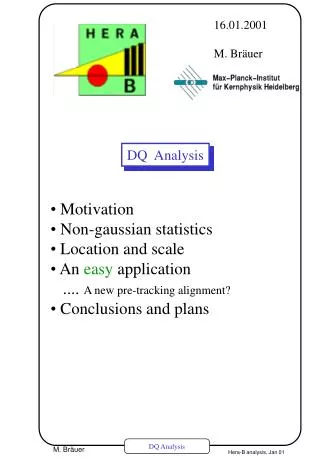
16.01.2001 M. Bräuer DQ Analysis • Motivation • Non-gaussian statistics • Location and scale • An easy application • .... A new pre-tracking alignment? • Conclusions and plans
Motivation • Physics needs clean and interpretable signals ! • => Gaussian statistics (Lep Higgs-analysis..) • We do have noise, bad hardware, process-noise • and hadronic dirt • One solution: DQ-systems! • Example: Searching for bad-VDS-chips • Get the deviation from the mean of a group • of chips The mean does not work too good! Histogramming and fiting? => even paw gives you a bad day!
Non-gaussian statistics There is a vast literature of analysis with heavy-tail-distributions: Outlier „Robust Statistics“ Understanding: Least-Squares: Leads to: Only in the gaussian case ! Otherwise: get rid of the square: Define: Assume:
Functions 1 Gauß: Median: „Paw“:
Functions 2 Huber: Tukey: Hampel:
Location and Scale Results: The robust guys do much better! BUT: It is your choice for parameters!
Application 1 Correlations saved not only my but at least once! Can we look for them automatically? It is an application of fits with robust statistics!
Application 1.1 1. Fight against the combinatorics
Application 1.2 2. nice results, but we need a guess!
Application 1.3 3. Line-guesses
Application 1.4 3. Line-guesses (cont.) 4. Estimating the scale: => The robust-statistics has its limits!!
Application 1.5 5. Lets fit: (Minimising, using ) REGRESSION with distance to 0 and angle!
Application 1.6 REGRESSION (cont.): Hampel (bad scale) sine-function:
Application 1.7 6. Line fit, hampel:
Application, results 1 7. Final:
pre-tracking alignment? • A new idea of pre-tracking: • The data is processed tracking-free! • One can relate the lines to alignment data: • => A lot of work still remains, but it looks good!
Conclusions and outlook • Sometimes the gauss-stuff does NOT hold! • Hard to simulate, but data is there in DQ applications • Nice results for simple tasks • even fitting in high-background data is possible • VDS alignment is as LeastSquares one. It had to be robustified to get better results! • There are good tools out, why not using them?