Download
1 / 8
80 likes | 224 Views
Comparing high-resolution precipitation products over NW Europe Chris Kidd 1 , Peter Bauer 2 , Joe Turk 3 , George Huffman 4 , Robert Joyce 5 , Kuolin Hsu 6 and Daniel Braithwaite 6 1 NASA/GSFC and UMD/ESSIC, 2 ECMWF, 3 NASA/JPL, 4 SSAI, 5 NOAA/NCEP, 6 UCI.

E N D
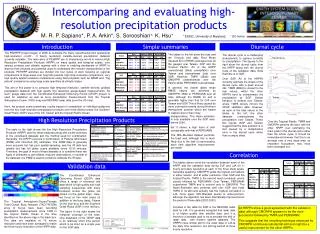
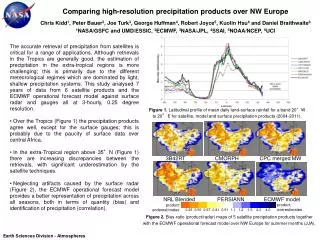
Comparing high-resolution precipitation products over NW Europe Chris Kidd1, Peter Bauer2, Joe Turk3, George Huffman4, Robert Joyce5, Kuolin Hsu6 and Daniel Braithwaite6 1NASA/GSFC and UMD/ESSIC, 2ECMWF, 3NASA/JPL, 4SSAI, 5NOAA/NCEP, 6UCI • The accurate retrieval of precipitation from satellites is critical for a range of applications. Although retrievals in the Tropics are generally good, the estimation of precipitation in the extra-tropical regions is more challenging; this is primarily due to the different meteorological regimes which are dominated by light, shallow precipitation systems. This study analysed 7 years of data from 6 satellite products and the ECMWF operational forecast model against surface radar and gauges all at 3-hourly, 0.25 degree resolution. • Over the Tropics (Figure 1) the precipitation products agree well, except for the surface gauges; this is probably due to the paucity of surface data over central Africa. • In the extra-Tropical region above 35°N (Figure 1) there are increasing discrepancies between the retrievals, with significant underestimation by the satellite techniques. • Neglecting artifacts caused by the surface radar (Figure 2), the ECMWF operational forecast model provides a better representation of precipitation across all seasons, both in terms of quantity (bias) and identification of precipitation (correlation). Figure 1. Latitudinal profile of mean daily land-surface rainfall for a band 20°W to 20°E for satellite, model and surface precipitation products (2004-2011). 3B42RT CMORPH CPC merged MW NRL Blended PERSIANN ECMWF model product overestimates product underestimates 0.25 0.50 0.67 0.81 0.91 1.1 1.2 1.5 2.0 4.0 Figure 2. Bias-ratio (product/radar) maps of 5 satellite precipitation products together with the ECMWF operational forecast model over NW Europe for summer months (JJA). Earth Sciences Division - Atmospheres
Name: Chris Kidd, NASA/GSFC, Code 612, & UMD/ESSIC E-mail: chris.kidd@nasa.gov Phone: 301-614-6091 References: Kidd, C., Bauer, P., Turk, J., Huffman, G.J., Joyce, R. Hsu, K-L., and Braithwaite, D. 2012: Inter-comparison of high-resolution precipitation products over Northwest Europe. Journal of Hydrometeorology , 13, 67-83, doi: 10.1175/JHM-D-11-042 Ebert, E.E., Janowiak, J.E., andKidd, C., 2007: Comparison of near real time precipitation estimates from satellite observations and numerical models. Bulletin of the American Meteorological Society 88, 47-64. Adler, R.F., Kidd, C., Petty, G., Morissey, M., Goodman, H.M., 2001: Intercomparison of global precipitation products: The Third Precipitation Intercomparison Project (PIP–3). Bulletin of the American Meteorological Society, 82, 1377–1396. Data Sources: Data processed for March 2004 through February 2011 included satellite precipitation products for 3-hourly, 0.25 degree resolution, the ECMWF operational forecast model precipitation output, the GPCC gridded precipitation product, the UK Met Office surface gauges and the UK Met Office ‘Nimrod’ radar network. Technical Description of Figures: Figure 1.Latitudinal profile of mean daily land-surface rainfall for a longitudinal band 20°W to 20°E (across Europe and Africa) for satellite, model, and surface precipitation products. Values represent the mean surface precipitation over the period March 2004 through February 2011 for the land surface (hence no information south of 36°S). The satellite precipitation products are generated at 0.25 degree resolution, while the surface gauge data are extracted from the GPCC 0.5 degree analysis; model data are mapped from the operational forecast model output. Figure 2.Bias-ratio (product÷radar data) maps of 5 satellite precipitation products together with the ECMWF operational forecast model over NW Europe for summer months (JJA). This study region covers and area 12°W to 18°E and 40°N to 60°N, centered on the coverage of European-wide radar data obtained from the UK Meteorological Office. Some radar artifacts are evident, such as the range-effects. However, it is clear that the satellite precipitation products underestimate the precipitation, while the operational forecast model slightly overestimates (typical of such models in the first 24-hour period). This represents a ‘best-case’ scenario; satellite precipitation estimates fair much worse during the winter, spring, and fall. Scientific significance: The results echo those of earlier studies (e.g., Adler et al. 2001 and Ebert et al. 2007) which demonstrated that the retrieval of precipitation in the extra-tropics is challenging. The poor performance of the satellite techniques can be attributed to a number of factors, including light-intensity precipitation, shallow precipitating systems, and mixed-phase precipitation; light/shallow precipitation constitutes more than 85% of the occurrence of precipitation and 45% of the precipitation accumulation at the higher latitudes. Relevance of research: This work identifies some of the shortcomings in the current global precipitation retrieval schemes. Many current techniques having been optimised for the estimation of precipitation in the Tropics; satellite techniques are currently being refined to better identify and quantify light, mixed-phase precipitation over the extra-tropical regions. The forthcoming Global Precipitation Mission (GPM) will help to address these shortcomings through the Dual-frequency Precipitation Radar (DPR) and the GPM Microwave Imager (GMI), both of which have greater sensitivities to light precipitation and snowfall. Earth Sciences Division - Atmospheres
Assimilating Simulated HIWRAP Doppler Velocity Data into Hurricane ForecastsJason Sippel* and Scott Braun, Code 612, NASA/GSFC, *GESTAR/MSU • This study utilizes ensemble Kalman filter (EnKF) simulated-data experiments to analyze the potential impact of assimilating radial velocity observations with the High-altitude Imaging Wind and Rain Airborne Profiler (HIWRAP). HIWRAP is a new Doppler radar mounted on the NASA Global Hawk unmanned airborne system that flies above hurricanes and has the benefit of a 25 to 30-hr flight duration, which is two to three times that of conventional aircraft. The most important result from this research is that HIWRAP data can be used for hurricane analyses and prediction. • By the end of a 12-h assimilation, the analysis error is up to 80-90% less than in a deterministic forecast in terms of the horizontal wind and temperature variables. • Subsequent forecasts initialized with the EnKF analyses also improve considerably. • Analyses and forecasts benefit more from a 12-h assimilation period than for shorter periods. • The full benefit of EnKF analyses might not be realized with the typical on-station time of current Doppler-radar-bearing operational aircraft. Figure 1. A comparison of (a-c) track, (d-f) minimum sea-level pressure (SLP), and (g-i) maximum 10-m winds from the truth scenarios (cyan), a deterministic forecast without assimilation (NODA; circles), and EnKF-initialized deterministic forecasts (varying shades of red for analysis times are indicated in the legend). Differing truth scenarios are shown in each column. Earth Sciences Division - Atmospheres
Name: Jason Sippel, NASA/GSFC, Code 612 E-mail:jason.sippel@nasa.gov Phone: 301-614-6285 References: Sippel, J. A., S. A. Braun, F. Zhang, and Y. Weng, 2012: Ensemble Kalman Filter Assimilation of Simulated HIWRAP Doppler Velocity Data in a Hurricane. Accepted to Monthly Weather Review. Data Sources: Global Forecast System (GFS) analysis and forecast files are used for the initial and boundary conditions of the NODA forecast. The ‘truth’ scenarios use similar initial and boundary conditions, but with random, large-scale perturbations added. Technical Description of Figures: The long duration of the Global Hawk gives it a much larger range and on-station capabilities than conventional aircraft, making it a desirable addition to other observing platforms. This study is intended as a proof-of-concept for future assimilation of real HIWRAP data. Figure 1. A comparison of (a-c) track, (d-f) minimum SLP, and (g-i) maximum 10-m winds from the truth scenarios (cyan), a deterministic forecast without assimilation (NODA; circles), and EnKF-initialized deterministic forecasts (varying shades of red for analysis times are indicated in the legend). The NODA deterministic forecast was created by integrating the Weather Research and Forecasting (WRF) model forward in time using initial and boundary conditions from the Global Forecasting System (GFS) analysis at 00 UTC 16 September, 2010. The study loosely focuses on Hurricane Karl, which rapidly intensified over the Bay of Campeche over the subsequent 48 hr. An ensemble of random, large-scale perturbations to the GFS fields was also created and integrated forward in time with WRF to generate the initial first-guess EnKF covariance field. The truth scenarios were created by integrating WRF from extra sets of initial and boundary conditions in the aforementioned ensemble. The truth microphysics scheme is also different so that some degree of model error is taken into account. Scientific significance: The results indicate that the WRF-EnKF system is capable of accurately analyzing a hurricane using radial velocity data from HIWRAP. Given the long range of the Global Hawk, these results show that accurate mesoscale analyses are feasible for tropical cyclones that are very far from land. In the future, such analyses could lead to considerable improvements in real-time tropical cyclone forecasts. These analyses can also be used to study tropical cyclone intensity change, thus leading to a better understanding of tropical cyclones. Relevance for future science and relationship to Decadal Survey: This work demonstrates the future potential of unmanned aerial reconnaissance into hurricanes, and it also shows how data from the 2012-2014 Hurricane and Severe Storm Sentinel (HS3) Earth Venture-1 campaign can be used to study hurricane intensity change. Future work will assess assimilation of multiple types of observations taken from the Global Hawks, and the resulting analyses have the potential to give significantly more insight into hurricanes than any single set of observations. Earth Sciences Division - Atmospheres
Contribution of different cloud regimes to the tropical precipitation budgetDongmin Lee and Lazaros Oreopoulos, Code 613, NASA GSFC In order to understand the water budget of the planet it is important to measure the rainfall distribution. We can now achieve relatively good rainfall estimates from satellites over almost the entire planet. Measuring only rainfall amounts is however not enough to understand the underlying physical processes determining where, when, and how much rainfall occurs. We must also observe and measure other atmospheric characteristics related to rainfall, such as cloud properties. In this paper we propose a method to help us better understand what cloud regimes (as defined by distinct “weather states” or WS) the precipitation of the extended tropical region originates from. The tropics are of special interest because they cover about half the area of the planet and produce the strongest rainfall intensities. We can partition the tropical precipitation by WS (see examples of tropical WS in Fig. 1–how they are defined and where and how often they occur) by combining different satellite measurements targeted to rainfall and joint cloud optical thickness/cloud top height distributions. An important finding is that in the tropics about half of the total rainfall comes from one particular cloud mixture, associated with deep storm systems, WS1 (Fig. 2). Surprisingly, our combined datasets indicate that even these clouds are often (about half the time) not precipitating (Fig. 3); when they do, they tend to precipitate stronger over ocean than land. Our analysis suggests that this is because oceanic WS1 cloud regimes are larger and longer-lasting. The results may be used to investigate whether climate models partition precipitation in accordance with observations, and to therefore indirectly assess whether predictions of future precipitation in a changed climate can be trusted. low RFO high RFO Figure 1: Maps of the relative frequency of occurrence (RFO) for three (of eight) tropical weather states (WS) defined by the joint histograms of cloud top pressure and optical thickness (left). Figure 2: Domain-average values of the mean precipitation rates and fractional contributions to the total tropical precipitation. Also included is the domain-average RFO of each weather state. Figure 3: Cumulative histograms of precipitation rate for each of the eight tropical weather states. Earth Sciences Division - Atmospheres
Name: Dongmin Lee and Lazaros Oreopoulos, NASA/GSFC, Code 613 e-mail: Lazaros.Oreopoulos@nasa.gov phone: 301-614-6128 References: D. Lee, L. Oreopoulos, G. J. Huffman, L., W. B. Rossow, and I.-S. Kang, 2012: The precipitation characteristics of ISCCP tropical weather states. J. Climate, in press. Preview available at http://journals.ametsoc.org/doi/abs/10.1175/JCLI-D-11-00718.1 Data Sources: International Satellite Cloud Climatology Project (ISCCP) weather states, TRMM-adjusted merged-infrared (IR) precipitation (TMPA-3B42) and Global Precipitation Climatology Project (GPCP-1DD) precipitation. Technical Description of Figures: Figure 1: Maps of the relative frequency of occurrence (RFO) for three tropical weather states defined by the joint histograms of cloud top pressure and optical thickness to the left (the vertical colorbar indicates % occurrence within each bin). The RFOs come from 10 years (1998-2007) of ISCCP data. The three (out of eight in this region–shown in the reference given above) cloud regimes chosen represent cloud mixtures dominated by deep convection (WS1), unorganized convection with large amounts of cumulus congestus (WS3) and marine stratocumulus (WS5). Figure 2: Domain-average values of the mean precipitation rates and fractional contributions corresponding to each of the eight tropical ISCCP weather states . Also included is the domain-average RFO of each weather state. One can see that despite an RFO of only ~6%, WS1 contributes about half of the total precipitation in the ±35° latitude zone. This is because the mean precipitation rate of ~19 mm/day for this state is more than four times larger than that of the next strongest precipitating weather state (WS2). Figure 3: Cumulative histograms of precipitation rate for each of the eight tropical weather states. The strongest precipitating state, WS1, about half the time WS1 is not precipitating according to TMPA-3B42. This large fraction of non-precipitating deep cloud systems may however be an overestimation given the inherent weakness of the algorithm to detect light precipitation and our inability to achieve exact spatiotemporal matching with the data sets at hand. Still, WS1 produces precipitation rates greater than 70 mm/day about 10% of the time. Scientific significance: Since clouds are the most prominent regulators of radiation and precipitation, the connections between precipitation, radiation, and the state of the atmosphere as a function of cloud regime using a weather state framework should be further explored. To some extent work along these lines has already been performed, but the unifying effort that will fully integrate the physical relationships between atmospheric dynamical and thermodynamical states and the budgets of radiation and precipitation into a coherent picture has not yet materialized. Once such an effort is completed, a better foundation on how to analyze cloud regimes and associated meteorology in conjunction with energy and water budgets will be available for climate models to capitalize on. This can potentially lead to significant leaps in the quality of model hydrology and energetics. Relevance for future science and relationship to Decadal Survey: Our understanding of how different cloud regimes contribute to the water budget of the planet needs to be improved. One way of achieving this is to combine cloud classifications from passive and/or active sensors with simultaneous space-based precipitation estimates. Such studies can be conducted with NPP/JPSS and GPM cloud and precipitation retrievals. Earth Sciences Division - Atmospheres
Characterization of Absorbing Aerosols Above Cloud from MODIS Hiren Jethva, Omar Torres, and P. K. Bhartia, Code 614, NASA GSFC Lorraine A. Remer, UMBC/JCET Particulate matter suspended in the atmosphere, called aerosols, scatter as well as absorb the incoming solar light and thus play a vital role in determining the Earth's radiation balance and climate change. Carbonaceous aerosols such as those generated from biomass burning activities, and wind-blown dust particles are major absorbing types of aerosols found in the atmosphere. They can lead to cooling or warming of the Earth's environment depending upon their absorption strength and brightness of underlying surface. When located above the cloud deck, the absorbing aerosols heat the atmosphere and reduce the light measured by satellite. This effect is called “cloud darkening” and it can be seen in satellite images. Quantification of aerosol load above clouds has been a challenge for the remote sensing community. We have used the spectral reflectance data collected by the space-borne Moderate Resolution Imaging Spectroradiometer (MODIS) to quantity the optical depth of above-cloud aerosols. The present technique, an extension of a previously developed method applied to the OMI data, uses color ratio information measured by MODIS to deduce aerosol load and cloud brightness simultaneously. Cloud-free aerosol retrievals Above-cloud aerosol retrievals Figure 1: A True-color MODIS RGB image, as if seen by a human eye from space, of an above-cloud smoke plume over southern Africa and adjacent oceanic region. Figure 2: The above-cloud AOT retrieved from MODIS for the image in Figure 1. The results from the present research will provide much needed information on the aerosol and cloud optical properties for the overlap regions, which are critical in determining the aerosol impact on the Earth’s radiation balance and thus on climate change. Figure 3: Above-cloud AOT retrieved from OMI observation for the same area. Earth Sciences Division - Atmospheres
Name: Hiren Jethva, NASA/GSFC, Code 614, USRA/GESTAR E-mail: hiren.t.jethva@nasa.gov Phone: 301-614-5225 References: Jethva, H., O. Torres, L. A. Remer, P. K. Bhartia (2012), A color ratio method for simultaneous retrieval of aerosol and cloud optical thickness from passive sensors: Application to MODIS Measurements, submitted to the IEEE Transactions on Geoscience and Remote Sensing Torres, O., H. Jethva, and P. K. Bhartia (2012), Retrieval of aerosol optical depth above clouds from OMI observations: sensitivity analysis and case studies, Journal of Atmospheric Science, 69, 10371053, doi:http://dx.doi.org/10.1175/JAS-D-11-0130.1. Data Sources: Spectral reflectance dataset from Aqua satellite Moderate Resolution Imaging Spectroradiometer (MODIS ) and Aura/Ozone Monitoring Instrument (OMI) Technical Description of Figures: Figure 1: A true-color MODIS visible RGB image captured on Aug 12, 2006 showing a plume of smoke advected over low level cloud deck over the southeastern Atlantic Ocean. Figure 2: A composite spatial distribution of the above-cloud AOT (500 nm) retrieved by the color ratio technique and cloud-free MODIS standard product for the Aug 12, 2006 aerosol event. A large plume of smoke with AOT up to 2.0 retrieved by the color ratio method is found to be in good agreement with cloud-free retrievals around the edge of cloud/clear boundaries. Figure 3: A composite spatial distribution of the above-cloud and cloud-free AOT (500 nm) retrieved using the near-UV measurements made by OMI for the same case. Scientific significance: The presence of aerosols over the cloud-free areas generally results in a negative radiative forcing (or cooling) at the top-of-atmosphere. However, when the absorbing aerosols such as carbonaceous aerosols generated from the biomass burning activities and wind-blown dust particles moves over low-level cloud decks, they absorb a portion of the cloud reflected radiation and thus exert a net warming effect. The magnitude of the resulting warming of an atmospheric column depends on the aerosol load, cloud brightness (optical depth), and cloud cover beneath the absorbing layer. The present technique provides much needed quantification of aerosol-cloud overlap properties which will allow to us to estimate the direct radiative forcing of aerosols above cloud-a critical component of all-sky aerosol climate forcing. Relevance for future science and relationship to Decadal Survey: The satellite-based detection and quantification of aerosols above cloud is huge leap in the ongoing era of the remote sensing. The space-borne sensors like OMI (2004 onwards) and MODIS (since 2000) and recently launched NPP-OMPS and NPP-VIIRS can be greatly benefited by applying the present technique to their respective records for deducing operational products. The planned future missions such as Geo-CAPE and PACE will continue the long-term record of the UV and visible aerosol measurements. Earth Sciences Division - Atmospheres