Download
1 / 7
70 likes | 89 Views
The whole process of calculating long term return and choosing the right risk profile is a complex task. Investment Excel will guide you through this PPT, on how to calculate Portfolio risk and expected long term portfolio return in an extremely easy manner.

E N D
Of course, the very process of trading is complex, as it involves a number of steps into it, such as stocks selection, the formation of strategies, and creation of a portfolio and so on. • But much before you would measure the risk your online investment portfolio holds, the calculation of average yearly return must be done. +45-25685705 www.investmentexcel.com info@investmentexcel.com
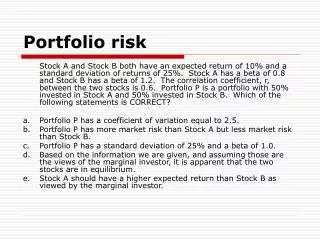
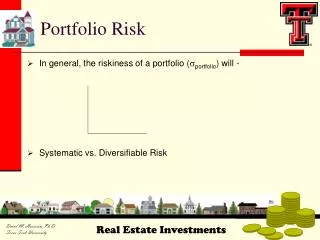
Within Portfolio Standard Deviation, the rate of return on an investment portfolio is used to measure the inherent volatility of an investment. • This helps you to calculate the investment’s risk and helps in analyzing the stability of returns of the investment portfolios. +45-25685705 www.investmentexcel.com info@investmentexcel.com
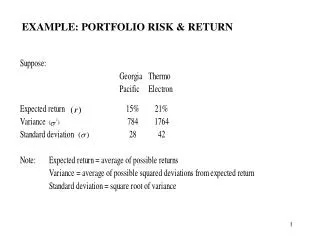
Carol wants to invest every month in one of the two Funds. She wants to check the stability of returns while investing. Here both funds are having an average rate of return of 12%. • Fund A holds a Standard Deviation of 14 with average return between -2% to 26%. • Fund, B holds the Standard Deviation of 8 with average return between 4% to 20%. • Considering the risk Carol must prefer investment in Fund B compared to Fund A since it brings more average return with less amount of volatility. +45-25685705 www.investmentexcel.com info@investmentexcel.com
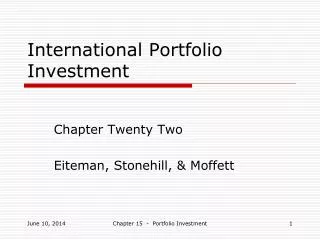
If you are looking forward to gaining on the Portfolio Return, then you must consider the Standard Deviation of Two Asset Portfolio, which would be something like this… Further, you must find: • Standard Deviation of each asset in the Portfolio • Weight of each asset in the overall Portfolio • Bring the correlation between the assets in the Portfolio. +45-25685705 www.investmentexcel.com info@investmentexcel.com
Above all, something which again brings the utmost importance here is that each Standard Deviation is based on the historic data and Past results, but it is not easier to be achieved, as you might think it for since there are multiple facts & the factors which have to be considered. • In order to help you sail through with your long term return, reaching out to the professionals from Investment Excel would be your best choice and you can avoid the Portfolio Risk at a larger number. • Reach investment excel experts today and help your investment to bring out the successful result in an efficient manner. +45-25685705 www.investmentexcel.com info@investmentexcel.com
Thank You +45-25685705 www.investmentexcel.com info@investmentexcel.com