Download
1 / 10
100 likes | 107 Views
An easy and quick spectrophotometric method is developed for the investigation of cobalt at trace level using 1-(2-Thiazolylazo)-2-naphthol (TAN) in presence of surfactant cetyltrimethylammonium bromide (CTAB) aqueous micellar solution. The cobalt forms bis [1-(2-Thiazolylazo)-2-naphthol] cobalt complex reacting with 1-(2-Thiazolylazo)-2-naphthol. Proposed method is of great importance because use of micellar system instead of solvent extraction steps that were toxic, expensive and time consuming. The method shows improved sensitivity, selectivity and molar absorption. The coefficient of molar absorption and Sandellu2019s sensitivity was found to be u03b5 1.89 u00d7 104L mol-1 cm-1 and 3.1ngcm-2 at u03bbmax 572.7nm. Graph of Linear concentration calibration was obtained in the range 0.02-9.0u03bcgmL-1; stoichiometric metal ligand ratio was found 1:2 for the complex Co-[TAN]2 formation. The proposed method was applied for the investigation of cobalt from different alloys, biological, environmental and pharmaceutical samples. Full articles at https://lnkd.in/fbEHTJ6

E N D
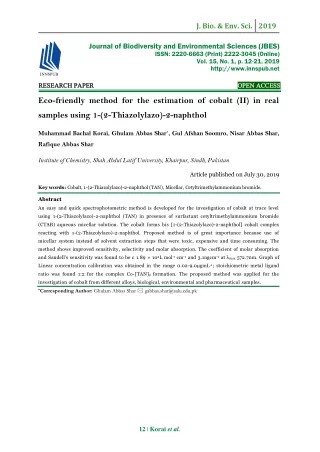
J. Bio. & Env. Sci. 2019 Journal of Biodiversity and Environmental Sciences (JBES) ISSN: 2220-6663 (Print) 2222-3045 (Online) Vol. 15, No. 1, p. 12-21, 2019 http://www.innspub.net RE RESEARCH SEARCH PAPER PAPER OPEN ACCESS OPEN ACCESS Eco-friendly method for the estimation of cobalt (II) in real samples using 1-(2-Thiazolylazo)-2-naphthol Muhammad Bachal Korai, Ghulam Abbas Shar*, Gul Afshan Soomro, Nisar Abbas Shar, Rafique Abbas Shar Institute of Chemistry, Shah Abdul Latif University, Khairpur, Sindh, Pakistan Article published on July 30, 2019 Key words: Cobalt, 1-(2-Thiazolylazo)-2-naphthol (TAN), Micellar, Cetyltrimethylammonium bromide. Abstract An easy and quick spectrophotometric method is developed for the investigation of cobalt at trace level using 1-(2-Thiazolylazo)-2-naphthol (TAN) in presence of surfactant cetyltrimethylammonium bromide (CTAB) aqueous micellar solution. The cobalt forms bis [1-(2-Thiazolylazo)-2-naphthol] cobalt complex reacting with 1-(2-Thiazolylazo)-2-naphthol. Proposed method is of great importance because use of micellar system instead of solvent extraction steps that were toxic, expensive and time consuming. The method shows improved sensitivity, selectivity and molar absorption. The coefficient of molar absorption and Sandell's sensitivity was found to be ε 1.89 × 10⁴L mol-1 cm-1 and 3.1ngcm-2 at λmax 572.7nm. Graph of Linear concentration calibration was obtained in the range 0.02-9.0μgmL-1; stoichiometric metal ligand ratio was found 1:2 for the complex Co-[TAN]2 formation. The proposed method was applied for the investigation of cobalt from different alloys, biological, environmental and pharmaceutical samples. *Corresponding Author: Ghulam Abbas Shar gabbas.shar@salu.edu.pk 12 | Koraiet al.
J. Bio. & Env. Sci. 2019 Introduction solvent extraction with the use of micellar system Metals play important role in biological and daily life. (surfactants) (Soomro and Shar, 2015). Micellar Metals may potentially be essential like cobalt, zinc, methods show enhancement in the investigative nickel, manganese copper, iron etc and toxics such as qualities of methods for the analysis of metal ions in cadmium, arsenic, mercury , lead, etc (Dogan Uluozlu solubilizing the complex (Hosseinzadeh et al., 2013; et al., 2007). Sometimes intake of essential metals in Hosseinzadeh and Gheshlagi, 2009; Ketola, 2016; excessive amount can also produce toxic effects over Khammas, 2009; Olkowska and Polkowska, 2012; human health (Singh et al., 2011). Cobalt is Wani et al., 2017). Several procedures for the significant element for biological (Amin, 2014) as well spectrophotometric analysis of cobalt with different as industrial processes. In living systems, it is an complexing agents are presented (Afifi et al., 2014; essential micronutrient. It is an important constituent Chandramouleeswarn and Ram Kumar, 2014; Guzar of vitamin B12 (El Sheikh, 2015; Nekouei, F and and Jin, 2008; Hussein et al., 2016; Modawe and Nekouei S, 2014), it plays vital role in the production Eltayeb, 2013; Raju et al., 2013). Recently some less of RBC and pernicious anemia can be prevented by sensitive and less selective spectrophotometric the use of cobalt in suitable amounts. Cobalt (II) in methods are developed for the determination (Fornea low concentration is necessary for functions of et al., 2016). We have developed a convenient, quick, enzyme in all mammalians (Bhattacharya et al., selective and sensitive method for the investigation of 2016). Insufficiency of cobalt may cause thalassemia, Co (II) in different substances by utilizing TAN as sickle cell anemia, hematological and polycythemia chelating agent in surfactant CTAB micellar media. disorders (Prashanth et al., 2015). Material and method Although the higher amounts of cobalt may be toxic UV-Vis Cecil CE 9500 spectrophotometer having and may causes, nausea, vomiting, dermatitis and quartz cells with path length of 10 mm. Atomic pulmonary disorders (Czarnek et al., 2015; absorption spectrophotometer (Analyst-800 Perkin Naeemullah et al., 2012). Cobalt has a narrow Elmer) model. FTIR spectrophotometer (NICOLET difference between essential and toxic concentration iS10). pH/conductivity meter (Sension 160 HACH levels, its determination and analysis at micro-levels Company USA) model. in diverse matrices is required to evaluate and the development of analytical procedures that are more Preparation of Reagents reliable is necessary. 0.3 to 4.0mg of cobalt is The cobalt (II) ion stock solution (1000µg/L) was required per day as a cyanocobalamine (Korai, 2019). prepared from high purity Co(NO3)2.6H2O, supplied by (Merck, Darmstadt, Germany) in double distilled Nowadays, it has been immense concern about the water (Ghali, 2014), while other required metal ion function of cobalt in bio-chemical (Scharf et al., 2014) solutions were prepared from their nitrate and and ecological systems (Reddy et al., 2011). Special chloride salts. TAN soIution (4×10⁻³M) was prepared alloys of cobalt are employed as prosthetic pieces like by adding its 0.50g with small amount of methanol in knees and hips replacement (Devi and Reddy, 2012). 500mL measuring flask and the volume was made with CTAB 0.02M up to the mark (Ferreira and Nano, In spectrophotometric study of cobalt (II), the metal 1994). 0.02M solution of CTAB was prepared by is reacted with complexing reagent and insoluble taking its 7.28g in 1000mL measuring flask and the metal complex is formed then solubilized with solvent final volume was made up to the mark with deionized extraction (Drozd and Leonova, 2014; Teng et al., water (Korai, 2019). Insoluble chemicals were 2012; Zoubi, 2013). Various methods for solubilized in particular acids as to technique special spectrophotometric determination of cobalt have dissolution (Shar and Soomro, 2014).Buffers of pH 1 been developed to substitute the previous method of to 10 were made according methods (Perrin, 2012), 13 | Koraiet al.
J. Bio. & Env. Sci. 2019 by mixing appropriate volumes of KCl (0.2 M)-HCl reaches final colorless residue.Then NaOH was mixed to neutralize the sample and working solution was (0.2M) of both for pH 1.0 to 4.0, CH3COOH (0.2 M)- made in 50mL measuring flask. Though the solution CH3COONa (0.2 M) volumes for solution of pH 5.0 to was transferred in measuring flask and mixed 2mL 6.0, KH2PO4 (0.1 M)-NaOH (0.1 M) volumes for volumes of TAN 3×10⁻⁴ M, CTAB 0.02M and 2mL solution of pH 6.5 to 8.0 and sodium borate (0.025 M)- buffer of pH 9.5 in formation of complex. The HCl (0.1 M) volumes for preparation of the solution of outcomes are given in Table 4. pH 9.0 to 10.0. All the chemicals were used of Analysis of cobalt in environmental water samples analytical grade with high purity (Merck / Fluka). 1L of samples of waste water were collected from the General method for determination of cobalt (II) different places of Pano Akil District Sukkur and metal ions industrial area of Mirpur Mathelo district Ghotki, The different concentrations of cobalt ions ranges from Pakistan and were filtered and acidified by adding 0.06-10µgmL-1, 0.5 to 9×10⁻⁴ M concentration of TAN 2mL of H2O2 30% concentrated and 4mL of HNO3 solution (1-4×10⁻⁴ M), 2mL of buffer solutions of (conc.) (Iqbal et al., 2017). Then the obtained solution different pHs and 1-2mL of cetyltrimethylammonium was promoted for pre-concentration by placing in bromide (0.02M) were mixed into measuring flask of oven at about 110°C to get 25mL of solution at last. 10mL, mixture was shaken and final volume was made The solution was transferred into volumetric flask, with deionized water (Korai, 2019). The absorbance for mixed with 2mL of reagent TAN, 2mL of CTAB of cobalt metal ions at optimum conditions for metal 0.02M concentration and 9.5 pH buffer. Then the Co- complexes formation were observed at particular λmax TAN complex formed and the cobalt metal complex with UV-vis spectrophotometer (double beam CE- absorbance was recorded against blank (reagent). The 9500) having bandwidth of 2 nm and 5 nms-1 speed in obtained data is shown in Table 9. 10 mm quartz cells. Analysis of Co (II) ion in tap water sample Investigation of Co (II) ions in alloys sample Tap water sample was taken from area of Khairpur, The cobalt alloy sample of 0.1 to 0.5g of reference Sindh. Then the solution was filtered using 0.45µm filter substance JSS 607-6 was added in 15mL of paper and acidified by adding 1mL of concentrated concentrated HCl and 5.0mL of concentrated HNO3 HNO3 to prevent from precipitation. Metal cobalt was in beaker. The volume of sample solution was reduced added in the sample in measuring flask, mixed 2mL to 5mL by placing it on a hot plate.Then 10mL of volumes TAN 3×10⁻⁴M, 2.0mL of pH 9.5 buffer solution concentrated HCl was mixed, filtered and diluted to and 2mL of CTAB 0.02M then absorbance for complex 25mL volume by adding double distilled water (Shar was measured as shown in Table5. and Soomro, 2014). The sample was transferred in Investigation of Co (II) metal ions in biological measuring flask, mixed 2ml volume TAN 3×10⁻⁴ M, samples CTAB 0.02M and 2mL buffer of pH 9.5 in formation The sample of tea leaf 0.1 g was taken in a measuring of complex. The outcomes are given in Table 3. utensil and digested with 5mL volume of HNO3 conc. with warming. Then filtered and diluted the sample Investigation of cobalt (II) ion in Pharmaceutical solution and the solution were transferred into sample measuring flask and mixed 2mL volume TAN volume, Neurobion ampoule injection (Merck company) 0.02 M CTAB 2mL volume and 2mL of buffer solutions (vitamin B12)sample 1.0mL was taken in 50mL of of 9.5 pH for formation of metal chelate. Then flask adding 10mL of HNO3 and H2SO4 by the (10:1) absorbances were observed spectrophotometrically for ratio, the solution was warmed to dryness (Mallah et cobalt (II) metal ion. The amount of cobalt was al., 2012). The residuewas leached with dilute calculated and is shown in Table 6. sulphuric acid and diluted to the solution till it 14 | Koraiet al.
J. Bio. & Env. Sci. 2019 Investigation of Cobalt (II) in hair samples successive dilution method. Then the samplewas The hair samples were washed and subjected to transferred in measuring flask and mixed the 2mL ultrasonic vibration for 1 hour in acetone, water, volume TAN, 0.02 M CTAB 2mL volume and 2mL of water and acetone separately in the 100mL volume. buffer solutions of 9.5 pH for formation of metal The samples were filtered and dried. After weighing chelate and determined spectrophotometrically for the samples, they were digested in nitric acid 2.5mL cobalt (II) metal ion. The amount of cobalt was volume and kept at 60oC overnight in oven. These calculated and the results are shown in Table 8. samples were taken in calibrated flask (DaAntonio, 1982). Then NaOH was mixed to neutralize the Results and discussion samples and working solutions were made in 50mL TAN is tridentate chelate reacts with Co(II) by measuring flask. Though the solutions were bonding through two atoms of nitrogen and one atom transferred into measuring flask and mixed 2mL of oxygen in TAN after deprotonation. The structure volume TAN, 0.02 M CTAB 2mL volume and 2mL of of the complex bis [1-(2-Thiazolylazo)-2-naphthol] buffer solutions of 9.5 pH for formation of metal cobalt is shown in Fig. 1. UV-vis spectrum of TAN chelate and determined spectrophotometrically for showed broad peak (π→π*) electron transitions from cobalt (II) metal ion. The amount of cobalt was one ligand to another (L→L) of nitrogen atom of nitro calculated and the results are shown in Table 7. group at λmax 488.5 of C=N group, OH group and N=N double bonds is shown in Fig. 2. UV-Vis Determination of Cobalt (II) in nail samples spectrum of Co(II)-TAN compound gave The samples were collected, washed with double bathochromic shift termed as red shift by 84.2 nm. distilled water and dried in oven. Then the samples Transformation of charge from TAN to Co(L→M) was were digested by adding the 10mL of nitric acid conc. observed from the orbitals of TAN (pπ) to Co(dπ) at and perchloric acid in the ratio of 6:1 ratio of mixture λmax 572.7 (ε1.89×10⁴L mol-1cm-1). Co(II)-TAN spectra and kept them at room temperature overnight. Then showed that after deprotonation of -OH atom and the obtained solution was promoted for pre- C=N group and N=N are taking part in TAN-chelate concentration by placing in oven at about 160-180oC are shown in Fig. 3. The Co-complex gave reddish to get 1mL of solution at last (Mehra and Juneja, brown colour rapidly and gave the same constant 2005). Then NaOH was mixed to neutralize the maximum absorbance up to 60 minutes. Co-TAN samples and working solutions were made in 50mL complex at room temperature showed no any change measuring flask. Though the solutions were in absorbances until 24 h. The TAN reagent transferred in measuring flask and mixed the suitable concentration effect on the Co-TAN complex TAN volume, 0.02 M CTAB 2mL volume and 2mL of formation was investigated by varying TAN reagent buffer solutions of 9.5 pH for formation of metal concentration (Khadem et al., 2010) 0.5 to 10.0×10⁻⁴ chelate and determined spectrophotometrically for M, while Co (II) ions concentration was kept constant cobalt (II) metal ion. The amount of cobalt was 1m.mole. Concentration of the reagent TAN was calculated and is shown in Table 7. optimized by taking 1m.mole Co ions reacted with TAN in molar ratio of 1:3×10⁻⁴ M forming Co-TAN Investigation of Cobalt (II) in Pharmacological complex showing maximum absorbance. TAN 3×10⁻⁴ tablet samples M concentration showed Co-TAN complex formation The samples of known amount were taken and with maximum absorbance is shown in Fig. 4. digested with 3mL volume of HNO3 0.01M, heated to Thereforeconcentration of TAN reagent was kept dryness and residue was dissolved in alcohol. The 3×10⁻⁴ Mconstant in the throughout studies. solution was then filtered and made it diluted upto Stoichiometric Co-TAN compositions were 100mL with deionized water. The stock solutions of determined using Job’s method (Cherdantsevaa et al., the lower concentrations were made by suitable 2010; Jayanna et al., 2010; Patel et al., 2016; Reddy 15 | Koraiet al.
J. Bio. & Env. Sci. 2019 et al., 2016) by varying both Co and TAN the formation of metal chelate absorbance. Various concentrations by molar-ratio method.Co-TAN metal masking agents such as thiocyanate, phosphate, against ligand ratio was found 1:2 (M:L2). 0.02M citrate, and fluoride were utilized to eliminate the CTAB 2mL volume of surfactant solution showed more effect of foreign interfering species (Rajni and maximum constant absorbance, which was above the Usha, 2012) as shown in Table 2. cmc value. In complex formation different pH was Table 2. Effect of foreign ions on the Co(II)-[TAN]2. kept and investigated the optimum pH where the Metal ions / salts Na2tartarate KSCN, KClO3 NaF, CH3COO- Na2citrate, Pb(II) Al(III) Bromide, Iodide, Chloride, Borate, Na2C2O4 EDTA, Cyanate, Cd(II),Mn(II), Hg(II), Fe(II) Ni(II) Zn(II) Co(II) Cu(II) Cr(III) Cr(IV) Cobalt 1500 1100 2100 500 100 200 absorbance was showed maximum. pH 9.5 was measured optimum pH (Kuliyev, 2016) for Co (II)- (TAN)2 complex formation is given in Fig. 5. Calibration linear concentration graph was obtained at 0.02-9.0μgmL-1, with correlation coefficients 0.9991 is given in Fig. 6. Coefficient of molar 10 100 100 100 - 10 60 8 absorptivity was obtained ε1.89×10⁴ L mol-1cm-1 at λmax 572.7 is shown in Table 1. The Sandell’s sensitivity was found 3.1ngcm-2 is shown in Table1, showed improvement.Detectionlimit was obtained to be 3.1ngmL-1 is given in Table1. FTIR spectra of TAN aqueous gave absorption band at Table 1. Analytical parameters of Co(II)- [TAN]2 in 3342.70cm-1 for ν (OH) group and 2948.39 for ν (C-H) CTAB 0.02M. (C-N) and 1651.39 for aromaticity are shown in Fig. 7. Parameters Wavelength (λmax) pH CTAB (Surfactant) 0.02M TAN concentration Metal to Reagent ratio (M:R) Linear range Coefficient of molar absorptivity Sandell’s sensitivity Detection limit (R2) (% RSD) Cobalt 572.7 nm 9.5 2.0mL 3.0×10⁻⁴ M 1:2 0.02-9.0 µgmL-1 1.89×10⁴ Lmol- 1cm-1 3.1 ngcm-2 3.1 ngmL-1 0.9991 0.80 4000 cm-1-1500 cm-1 showed the stretching while while 1500 cm-1-550 cm-1 showed finger print region (Korai, 2019).The Co (II)-TAN complex showed lower wave numbers by 3335.77 cm-1 for ν (OH) group and 2940.55 for ν(C-H) (C-N) and decrease to 1657.06 for aromaticity of ν(Co-TAN). New bands suggested Co (II)-TAN bonding as shown in Fig.8. Precision and accuracy 2.0µg/mL of metal complex was chosen to examine Neurobion injection (Merck), Alloy JSS 607-6 and Tap water were tested for reliability and accuracy of the effect of interference under definite for the method, % age recovery test by adding calculated formation of metal complex was measured. The amount of Co (II) ions are given in Table 3-5. cations copper(II) and chromium(IV) were merely interfering species that exhibited the great influence Table 3. Determination of Co(II) in reference material. in the formation of metal complex. 1.0mL of masking agent EDTA was used to remove before more Alloys (%) Certified composition % Metal ions Metals Present Metals found % % Relative error RSD Recovery perchloric acid addition. Both copper (II) and Co(II) 14.01 µg 13.98 0. 40 cadmium (II) showed greater interference at minute JSS 607-6 0.14 99.78 µg level, which was lowered using 0.01M NaCN 1.0mL volume masking agent solution (Jain and Memon, Table 4. Determination of Co(II) in pharmaceutical samples. 2017). The high concentrations of SCN-, Br-, Cl-, Proposed method µg/mL AAS method µg/mL Analyte ions RSD % RSD % Recovery % Samples ascorbic acid and I- have not experienced Neurobion (Inj) 21.74 µg/mL interference. 1500µg/mL concentration of sodium Co(II) 21.68 0.4 21.69 0.4 98.0 tartrate has not revealed any interfering influence in 16 | Koraiet al.
J. Bio. & Env. Sci. 2019 Table 5. Percent recovery of known amount of Co(II) Table 8. Determination of Co (II) metal ions in added to tap water. pharmaceutical tablet samples. Cobalt content (µg/mL) Reported Metal ions Co(II) Co (II) added 0.60 mg/mL Co (II) found 0.59 mg/mL % Sample (mg/tablet) Found Recovery 98.33 Neurobion forte (cyanocobalamine 15 mg) Basiton forte (cyanocobalamine 15 mg) 7.45 7.44 7.42 7.43 Table 6. Determination of Co(II) in biological samples. Amount of cobalt (mg/g) Certified value 0.12 Sample Table 9. Determination of cobalt in environmental Present method 0.11 Tea leaves water sample. Alloy/ sample Certified (%) composition Proposed method (µg/mL) A.A.S method (µg/mL) Analyte ions RSD % RSD% %Recovery Table 7. Determination of Co (II) metal ions in hair and nail samples. Municipal water Co(II) 0.22 0.30 0.22 0.28 93.0 Analyte ions Co(II) Co(II) Proposed method (µg/L) 29.23 2.72 Industrial waste water sample, from Mirpur Mathelo Samples RSD% Co(II) 2.0 0.20 1.99 0.30 99.5 Hair Nail 0.3 0.4 Table 10. Comparison of cobalt(II) analysis procedures using TAN. Metals Reagent Co(II), Cu(II), Ni(II) Methods/Remarks λmax 618, 626 & 621nm , conc. range 0.05-1.05, 0.05-1.30 & 0.05-0.80µg/mL, D.L 0.018, 0.017 & 0.012ng/mL λmax405 & 425 nm respectively, ϵ 5.6× 10⁴& 2.3×10⁴Lmol-1cm-1 respectively, Beer's law range 0.055–1.373 & 0.118-3.534µg/mL respectively., D.L 0.095 & 0.04 µg/mL λmax491 nm, ϵ 0.2703× 10⁴ L mol-1cm-1, Beer's law range 3.00-50.00 µg/mL, D.L 2.083 µg/mL λmax417 nm, ϵ 2.86× 10⁴ L mol-1cm-1, Beer's law obeyed at 0.5-3.0 µg/cm3 In alcoholic λmax514 nm, ϵ 2.574x10³L mol-1cm-1, conc. range 0.7-30 µg/mL, D.L 0.51 µg/mL Reference TAN Niazi et al., 2008 2-hydroxy-1-naphthaldehyde-p- hydroxybenzoichydrazone (HNAHBH) Fe(II), Co(II) Devi et al., 2012 [2-(4methoxyphenyl) azo (4, 5- dipheny imidazole)] (MPAI) 5-nitrosalicylaldehyde semicarbazone (NSS) 4-(6-Bromo 2-benzothiazolylazo) Orcinol(6-BrBTAO) (N', N''E, N', N''E)- N', N'' - (2, 2' - (propane- 1,3diylbis(sulfanediyl)bis(1-(4- chlorophenyl) ethan -2-yl-1 - ylidene))bis(2hydroxybenzohydrazi de)(CAPSH) bis (5-bromosalicylaldehyde) orthophenilinediamine (BBSOPD) Hussein et al., 2016 Co(II) Co(II) Jain et al., 2017 Co(II) Ghali, 2014 in aqueous DMF, λmax380 nm, ϵ 7.9x10⁴L mol-1cm- 1, Beer's law obeyed at 0.059-0.59 µg/mL Reddy et al., 2016 Co(II) Co(II), Co(III) Chandramoulees waran et al., 2014 λmax458 nm, ϵ 5.3 x10⁴L mol-1cm-1, linear range is 0.2-6 mg L-1 λmax 572.7 nm, Molar absorpitivity ϵ1.89×10⁴ L mol-1cm1 , linear calibration range 0.02-9.0 µgmL-1 respectively Co(II) TAN * Present method Fig. 1. Proposed structure of bis[1-(2-Thiazolylazo)- Fig. 2. UV-vis spectrum of TAN reagent at in 0.02M 2-naphthol]cobalt. CTAB. 17 | Koraiet al.
J. Bio. & Env. Sci. 2019 95 90 85 80 75 %T 70 65 60 55 4000 3500 3000 2500 2000 1500 1000 500 Wavenumbers (cm-1) Fig. 7. FTIR spectra of TAN reagent. Fig. 3. UV-vis spectrum of Co-TAN in 0.02M CTAB. 98 1 97 96 0.9 95 0.8 94 0.7 93 %T 92 0.6 91 Absorbance 0.5 90 0.4 89 0.3 88 87 0.2 86 0.1 4000 3500 3000 2500 2000 1500 1000 500 Wavenumbers (cm-1) 0 Fig. 8. FTIR spectra of Co-TAN complex. 0 1 2 3 4 5 6 7 8 9 TAN (10-3M) Conclusions Fig. 4. TAN reagent conc. effect on the absorbance of The Co (II) determination in the present method showed Co (II)-TAN chelate. higher selectivity and sensitivity than reported extraction methods that are time taking and costly (Andres et al., 1994).The present method is precise, sensitive, selective, reproducible, non-extractivesimple, rapid and versatile spectrophotometric method for determination of cobalt (II) ions as reported in table 10. Acknowledgements The author Shar, G.A acknowledges Higher Education Commission (HEC), Pakistan for financial support under National Research Program to project R & D. References Fig. 5. Effect of pH on the absorbance of Co(II)-TAN. Afifi SY, Ghonaim AK, Atia BMM, Aly HF. 2014. Extraction and spectrophotometric determination of cobalt using 1,5-diphenylthiocarbazone (dithizone) and its application on geologic samples. Arab Journal of Nuclear Science and Applications 47(1), 61-64. Amin AS. 2014. Study on the solid phase extraction and spectrophotometric determination of cobalt with 5-(2-benzothiazolylazo)-8-hydroxyquinolene.Arabian Fig. 6. Calibration graph of cobalt-TAN complex at Journal of Chemistry 7(5), 715-721. λmax 572.7nm. 18 | Koraiet al.
J. Bio. & Env. Sci. 2019 Andres MPS, MarinamL, Vera S. 1994. Drozd A, Leonova N. 2014. Spectrometric Spectrophotometric determination of copper (II), determination of Ni2+, Co3+, Fe2+, Cu2+ concentration nickel (II), and cobalt (II) as complexes with sodium with 1-(2-pyridylazo)-2-naphthol in aqueous-micellar diethyldithiocarbamate in cationic micellar medium medium based on two intensive parameters. of hexadecyltrimethylammonium salts. Talanta Chemistry & Chemical Technology 8(2), 129-134. 41(2), 179-185. El Sheikh R, Gouda AA, El Sayed HA, Al Amin Bhattacharya PT, Misra SR, Hussain M. EM. 2015. Cloud point extraction, preconcentration 2016. Nutritional Aspects of Essential Trace Elements and spectrophotometric determination of cobalt in in Oral Health and Disease: An Extensive Review. water samples. International Journal of Pharmacy Scientifica2016, 1-12. and Pharmaceutical Sciences 7(9), 213-221. Chandramouleeswarn S, Ram Kumar J. 2014. Ferreira SLC, Nano RMW. 1994. Use of 1-(2- Speciation studies of cobalt (II) and cobalt (III) and thiazolylazo) 2-naphthol in rapid determination of iron its application to sample analysis. Indian Journal of in geological matrices. Talanta 41(11), 1937-1941. Advances in Chemical Science 2(2), 134-139. Fornea V, Trupina S, Iosub AV, Bulgariu L. Cherdantsevaa EV, Nesterovaa AV, Materna 2016. Spectrometric determination of Cu (II), Co (II) AI, Buldakovab LY, Yanchenkob MY, and Ni (II) ions in mono and multi-component Ishmetovac RI, Rusinov GL. 2010. On the systems. Buletinul Institutului Politehnic Din Iaşi composition of copper (II), cobalt (II), and nickel (II) 62(2), 9-20. complexes with some 3,6-disubstituted 1,2,4,5- tetrazines. Russian Journal of General Chemistry Ghali AA. 2014. Spectrophotometric Determination 80(9), 1860-1863. of Cobalt (II) Using 4-(6-Bromo 2-benzothiazolylazo) Orcinol as an Organic Reagent. Iraqi National Journal Czarnek K, Terpiłowska S, Siwicki AK. of Chemistry (53), 11-19. 2015. Review paper Selected aspects of the action of cobalt ions in the human body. Central European Guzar SH, Jin QH. 2008. Simple, selective, and Journal of Immunology2, 236-242. sensitive spectrophotometric method for determination of trace amounts of nickel (II), copper DaAntonio SM, Katz SA, Scheiner DM, Wood (II), cobalt (II), and iron (III) with a novel reagent 2- JD. 1982. Anatomically- related variations in trace pyridine carboxaldehyde isonicotinyl hydrazone. metal concentrations in hair. Clinical Chemistry Chem. Res. Chinese Universities 24(2), 143-147. 28(12), 2411-2413. Devi VSA, Reddy VK. 2012. Spectrophotometric Hosseinzadeh R, Gheshlagi M. 2009.Interaction and micellar solubilization of diclofenac with Determination of Iron(II) and Cobalt(II) by Direct, cetyltrimethylammonium bromide: a Derivative, and Simultaneous Methods Using 2- spectrophotometric study. Collection of Czechoslovak Hydroxy-1-Naphthaldehyde-p- Chemical Communications 74(3), 503-513. Hydroxybenzoichydrazone.International Journal of Analytical Chemistry2012, 1-12. Hosseinzadeh R, Khorsandi K, Hemmaty S. Dogan Uluozlu O, Tuzen M, Mendil D, Soylak 2013. Study of the effect of surfactants on extraction and determination of polyphenolic M. 2007. Trace metal content in nine species of fish compounds and antioxidant capacity of fruits from the Black and Aegean Seas, Turkey. Food extracts. PLoS ONE 8(3), 1-7. Chemistry 104, 835-840. 19 | Koraiet al.
J. Bio. & Env. Sci. 2019 Hussein FA, Hatam SR, Shaheed MI. 2016. Mehra R, Juneja M. 2005. Fingernails as biological Spectrophotometric Study for Determination of indices of metal exposure. Journal of Biosciences Cobalt (II) by the Reagent [2-(4-Methoxyphenyl) Azo 30(2), 253-257. (4, 5-Dipheny Imidazole)](MPAI). International Naeemullah, Kazi, TG, Shah F, Afridi HI, Khan Journal of Pharmacy And Pharmaceutical Research S, Arian SS, Brahman KD. 2012. A Green 6(4), 671-683. Preconcentration Method for Determination of Cobalt and Lead in Fresh Surface and Waste Water Samples Jain KNP, Memon IR. 2017. Complexation of Co Prior to Flame Atomic Absorption Spectrometry. (II) and Spectrophotometric Determination of the Journal of Analytical Methods in Chemistry2012, 1-8. complex using 5-Nitrosalicylaldehyde semicarbazone Nekouei F, Nekouei S. 2014. Determination of (NSS) as an Analytical Reagent. International Journal of Emerging Trends in Science and Technology copper, nickel and cobalt in water and food samples 4(2), 4970-4973. by FAAS after separation and preconcentration using multiwall carbon nanotubes modified by methyl-(2- Jayanna BK, Nagendrappa G, Gowda N. 2010. pyridyl) ketone oxime. Indian Journal of Scientific Research 8(1), 138-145. Niazi A, Yazdanipour A. 2008. Simultaneous A facile spectrophotometric method for the determination of cobalt (II) using iodine monochloride reagent. E-Journal of Chemistry spectrophotometric determination of cobalt, copper 7(4), 1426-1434. and nickel using 1-(2-thiazolylazo)-2-naphthol by Ketola A. 2016. Determination of surfactants in chemometrics methods. Chinese Chemical Letters 19(7), 860-864. Olkowska E, Polkowska Z, Namiesnik J. 2012. industrial waters of paper and board mills. Master’s Thesis, University of Jyväskylä. Khadem M, Golbabaei F, Froushani AR, Analytical procedures for the determination of surfactants in environmental samples. Talanta Shahtaheri SJ. 2010. Optimization of solid phase 88(2012), 1-13. extraction for trace determination of cobalt(II) using Patil YK, Lokhande RS, Rana PK, Janwadkar chromosorb 102 in biological monitoring. International Journal of Occupational Hygiene 2(1), 10-16. SP, Patil CY. 2016. Extractive spectrometric Khammas ZAA. 2009. Recent trends for separation determination of copper (II) by using 2-hydroxy-3- methoxy benzaldehyde thiosemicarbazone as an and preconcentration in metal ions and organic analytical reagent. World Journal of Pharmacy and compounds analysis after clould-point methodology: Pharmaceutical Sciences 5(2), 965-970. Developments and analytical applications – A review. Perrin DD. 2012. Buffers for pH and Metal ion Eurasian Journal of Chemistry 4(1), 1-35. Korai MB. 2019. Spectrophotometer Determination Control: Springer science & business media. Prashanth L, Kattapagari KK, Chitturi RT, of cobalt, nickel, iron, copper and zinc using 1-(2- Thiazolylazo)-2-Naphthol in Micellar Media. PhD. Baddam VRR, Prasad LK. 2015. A review on role of essential trace elements in health and disease. Journal of Thesis, Shah Abdul Latif University Khairpur, Sindh, Dr. NTR University of Health Sciences 4(2), 75-85. Pakistan. Mallah, A, Memon SQ, Solangi AR, Memon N, Rajni R, Usha G. 2012. Simultaneous Abbasi K, Khuhawar MY. 2012. A novel micellar determination of Zinc(II) and Cobalt(II) by first order electrokinetic chromatographic method for derivative spectrophotometry in Triton X-100 separation of metal-DDTC complexes. The Scientific micellar media. Research Journal of Chemical World Journal 2012, Article ID 743407, 1-8. Sciences 2(11), 8-13. 20 | Koraiet al.
J. Bio. & Env. Sci. 2019 Raju MM, Rao VT, Ramakrishna K. 2013. Direct Singh R, Gautam N, Mishra A, Gupta R. 2011. and derivative spectrophotometric determination of Heavy metals and living systems: An overview. Indian cobalt (II) using 3,4-dihydroxybenzaldehyde-1- Journal of Pharmacology 43(3), 246-253. (3chloro-2 quinoxalinyl) hydrazone (DHBCQH) in presence of micelle medium. International Journal of Soomro GA, Shar GA. 2014. A simple Scientific and Research Publications 3(4), 1-10. spectrophotometric method for the determination of cobalt (II) using 1-nitroso-2-naphthol in anionic Reddy KNP, Reddy TG, Kumar DS, Reddy aqueous solution of sodium dodecyl sulphate. AVR, Parveen NS, Reddy GCN. 2016. A new International Journal of Chemical Sciences hydrazone derivative as a sensitive analytical reagent 12(3), 982-992. for the determination of Co(II) in food, water and synthetic samples. International Journal of Soomro GA, Shar GA. 2015. Spectrophotometric Pharmaceutical Sciences and Research 7(1), 153-162. determination of copper(II) using 1-(2- pyridylazo)-2- naphthol in micellar solution of cetyltrimethyl Reddy KV, Reddy DN, Reddy KH. 2011. ammonium bromide. Asian Journal of Chemistry Derivative spectrophotometric determination of 27(4), 1361-1364. cobalt (II) and nickel (II) using 2-acetylpyridine-4- Teng TT, Yusup Y, Low LW. 2012. Heavy metal methyl-3-thiosemicarbazone (APMT). Journal of ion extraction using organic solvents: An application Chemical and Pharmaceutical Research 3, 835-839. of the equilibrium slope method, stoichiometry and research. The importance of quantity in biomedicine. Scharf B, Clement CC, Zolla V, Perino G, Yan Dr. ALESSIO INNOCENTI (Ed.), InTech. March. B, Elci SG, Santambrogio L. 2014. Molecular Wani AB, Singh J, Upadhyay N. 2017. Synthesis analysis of chromium and cobalt-related toxicity. Scientific Reports 4(1), 1-12. and characterization of transition metal complexes of para-aminosalicylic acid with evaluation of their Shar GA, Soomro GA. 2014. A simple antioxidant activities. Oriental Journal of Chemistry spectrophotometric method for the determination of 33(3), 1120-1126. copper (II) using 1-nitroso-2-naphthol as complexing Zoubi WA. 2013. Solvent extraction of metal ions by agent in micellar solution of sodium dodecyl sulphate. International Journal of Research in Chemistry and use of Schiff bases. Journal of Coordination Environment 4(3), 169-176. Chemistry 66(13), 2264-2289. 21 | Koraiet al.