Download
1 / 90
1.02k likes | 1.38k Views
Oceanic Dead Zones. Fall 2012 , Lecture 9. Observing the Ocean. Oceans cover about 70% of the earth’s surface Oceanography, the science of the ocean, has advanced greatly in the last two centuries

E N D
Oceanic Dead Zones Fall 2012 , Lecture 9
Observing the Ocean • Oceans cover about 70% of the earth’s surface • Oceanography, the science of the ocean, has advanced greatly in the last two centuries • The video on the next slide is a production of the Center for Ocean Science Education Excellence (COSEE), and gives a brief view of how oceanography is done today
“Dead” Zones • Some regions of the ocean may have, or develop, low oxygen zones naturally • One effect is the loss of marine life • Mobile life forms, such as fish, leave • Immobile forms often die • Habitats that would normally be teeming with life become, essentially, biological deserts, and are often termed “dead zones”
Animal Oxygen Requirements • Different organisms have different requirements for oxygen • Fish, because they are mobile, need more oxygen than benthic ogranisms
Effects of Hypoxia - 1 • Clams, oysters and other bivalves can survive for hours to days by closing their shells, ceasing to filter water, and going into a dormant state in hopes that normal oxygen conditions will soon improve • However, they too will die if hypoxia lasts long enough
Hypoxia Effects the Food Chain • With initial lowering of oxygen concentrations, worms and other animals that burrow deep in the mud will migrate closer to the surface in search of more oxygen • This makes them more vulnerable to fish that are capable of surviving temporarily in low oxygen conditions • Similarly, when fish and mobile invertebrates that rely on hiding from predators along the bottom swim out of a hypoxic area in search of more oxygen, they generally become more vulnerable to larger fish that will eat them.
Natural Dead Zones • Hypoxia occurs naturally in many of the world’s marine environments, such as fjords, deep basins, open ocean oxygen minimum zones, and oxygen minimum zones associated with western boundary of many oceans where upwelling occurs • Hypoxic and anoxic (no oxygen) waters have existed throughout geologic time, but their occurrence in shallow coastal and estuarine areas appears to be increasing as a result of human activities
Hypoxia and Anoxia • As we have seen, the scientific names for low oxygen conditions are: • Hypoxia - low levels of dissolved oxygen as the algae decomposes, defined as dissolved oxygen ≤ 2.0 mg l-1 • Anoxia – Near zero oxygen levels, defined as dissolved oxygen <0.2 mg l-1
Permanent Hypoxia • Some areas experience essentially constant hypoxia
Temporary Hypoxia • In others, hypoxia lasts from hours to days
Seasonal Hypoxia • Seasonal hypoxia occurs every year, during the warm months
Oxygen Solubility • One important reason for seasonal hypoxia has to do with oxygen solubility • Oxygen is more soluble in cold water, and solubility decreases as temperature increases
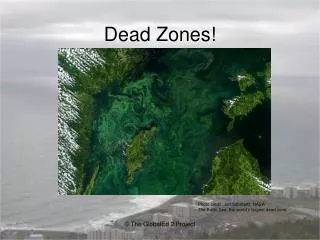
Satellite Observation • The Sea-viewing Wide Field-of-view Sensor (SeaWiFS) can’t see the bottom of the ocean, but it can see the surface, where sediments from rivers mix with ocean water
Satellite Imagery • The images shown here are SeaWiFS observations of the Mississippi River delta, the Yangtze River mouth in China (which is not currently identified as an area with an associated dead zone, but such conditions could develop there in the future), and the Pearl River mouth in China, near Hong Kong
Dr. Robert Magnien • Some of the information on the following slides is from a podcast with Dr. Robert Magnien, Director of NOAA's Center for Sponsored Coastal Ocean Research • Link is on the Information page
Anthropogenic Dead Zones • There are many physical, chemical, and biological factors that conspire to create dead zones, but nutrient pollution is the primary cause of those created by humans • Excess nutrients that run off land or are piped as wastewater into our rivers and coasts can stimulate an overgrowth of algae, which then sinks and decomposes in the water depletes the supply available to healthy marine life
Location of U.S. Dead Zones • Primary U.S. Oceanic Dead zones are found: • Along the East Coast • Along the Gulf of Mexico - the second largest dead zone in the world is located in the northern Gulf of Mexico
Northern Gulf of Mexico • The Mississippi River system is the dominant source of freshwater and nutrients to the northern Gulf of Mexico.
Mississippi River Flow • The discharge of the Mississippi River system is controlled so that 30% flows seaward through the Atchafalaya River delta and 70% flows through the Mississippi River birdfoot delta • About 53% of the Mississippi River delta discharge flows westward onto the Louisiana shelf
Nutrient Pollution • Mississippi River nutrient concentrations and loading to the adjacent continental shelf have greatly changed in the last half of the 20th century • During this time there has been a marked increase in the concentration of nitrogen and phosphorous in the Lower Mississippi River • This increase has been attributed to the increased use of nitrogen and phosphorous fertilizers, nitrogen fixation by leguminous crops, and atmospheric deposition of oxidized nitrogen from the combustion of fossil fuel
Nonpoint Sources • Nitrogen and phosphorous occur in four inorganic forms in the river: nitrate (NO3-), nitrite (NO2-), ammonium (NH4+), and orthophosphate (PO4-3) • Many of these nutrients enter the river from non-point sources like runoff, which are much more difficult and complex to control and monitor than point sources of pollution
Gulf Dead Zone History • Hypoxia was first documented in the northern Gulf of Mexico off the Louisiana coast in 1972 • Sporadic occurrences were observed in subsequent years • In 1975 and 1976, two cruises were conducted specifically to map a suspected area of low oxygen along the Louisiana coast • These maps indicated small, disjunctive areas of hypoxia • With an increase in oceanographic research in the Gulf of Mexico, more reports of hypoxia emerged
Later Research • The first concerted, continuous, and consistent documentation of the temporal and spatial extent of hypoxia on the Louisiana and Texas continental shelf began in 1985 with funding from the National Oceanic and Atmospheric Administration, National Ocean Service
Other Dead Zones in the U.S. • The Great Lakes, particularly Lake Erie • Chesapeake Bay • There is no part of the country, or the world for that matter, that is immune
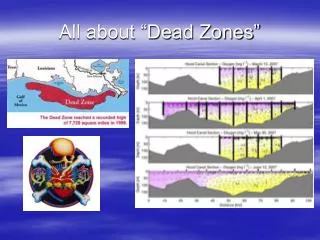
Gulf of Mexico Dead Zone Size • The size of the Gulf of Mexico dead zone actually varies from year to year • The average size, from 1993 to 2001, was about the size of the state of New Jersey or the states of Rhode Island and Connecticut combined
Dead Zone Duration and Location • As we saw in Chesapeake Bay, the duration of the dead zone events varies from year to year • The location also varies
Typical Dead Zone Scenario • Most dead zones start to form in the spring, most are severe in the summer, and then they break up in the fall • If spring rainfall is high, more nutrients can be washed into coastal waters and that leads to larger dead zones in that particular year
Winter Dead Zone Reset • The zone is reset, in a way, each winter, when seawater at the surface of the gulf gets cold and sinks, bringing oxygen-rich water back to the hypoxic bottom • The following summer, the zone reforms, according to Dr. Don Scavia, an aquatic ecologist with the University of Michigan
Size Variation • Its size varies from year to year, depending on how much nitrate-rich water is being funneled toward the sea from the Mississippi watershed, Dr. Scavia said • For example, because of 2011Mississippi flooding, last summer’s hypoxic zone was one of the larger sizes recorded – more than two times this summer’s
Hurricane Effects • Any oceanic region affected by a hurricane, such as the Gulf of Mexico, hurricane driven mixing can stir up the water sufficiently to re-oxygenate the bottom water, even in summer • Usually the dead zone reforms in about one to two weeks
Dead Zone Invisibility • From the surface, most dead zones are invisible • Diving into hypoxia zones, or using remote cameras, can sometimes reveal their presence • Factors leading to dead zone formation, such as large algal blooms, are visible
Dead Zone Numbers • The number of dead zones has greatly increased since the 1960’s • Over 400 dead zones worldwide have been documents • In the U.S., 166 have been documented
Economic Impacts • Exact economic impacts are largely unknown • In 2009, the Gulf of Mexico fisheries amounted to about $2.8 billion • How much was lost to the dead zone has yet to be quantified
Research Efforts • The Center for Sponsored Coastal Ocean Research in the National Ocean Service spent $27 million over 15 years on hypoxia research • That produced a Management Action Plan, first issued in 2001 and revised in 2008 • They issue seasonal predictions of the dead zones in the Gulf of Mexico and Chesapeake Bay
Recent Episodes • Chris Paschenko reported in The Galveston Daily News on August 13, 2012, “Low oxygen levels are believed to have killed possibly hundreds of thousands of Gulf menhaden fish found littering beaches and shorelines from Matagorda to Galveston, officials said Sunday.” (August12)
Why Menhaden? • Gulf menhaden, also known as shad, are more susceptible to fish killings than other species • Steven Mitchell, a biologist with the Texas Parks and Wildlife Department, said “Menhaden swim in the thousands of fish in schools, and when they get into trouble, they just can’t get out of it. I suspect the schools were swimming in a dead zone offshore, but we haven’t confirmed that.”
Red Tide Responsible • Low to moderate concentrations of red tide, an algal bloom known as Karelia brevis, also were believed to have caused fish kills in Galveston Bay • The presence of the algae prompted the Texas Department of State Health Services on Monday to close what little oyster harvesting was ongoing by public lease holders in Galveston Bay, department spokesman Chris Van Deusen said • Oysters are harvested commercially in Texas only from November to April
Galveston Fish Kill • Stan Lewis of Dallas rakes dead fish away from his family’s tent at Bermuda Beach in Galveston on Sunday • Officials said a red tide could be responsible for the fish kill • Photo by Jennifer Reynolds
Dead Zone and Drought • NOAA-supported scientists have found the size of the 2012 Gulf of Mexico oxygen-free ‘dead zone’ to be the fourth smallest since mapping of the annual hypoxic, or oxygen-free area began in 1985 • Measuring approximately 2,889 square miles, the 2012 area is slightly larger than Delaware
Dead Zone Variation • Scientists supported by the National Oceanic and Atmospheric Administration (NOAA) have been monitoring the size of the Gulf of Mexico dead zone since 1985 • From 1985 to 1992, the extent of the summer dead zone averaged about 3089 to 3475 square miles • From 1993 to 1997, the size of the dead zone had grown to 6178 to 6950 square miles • The largest dead zone ever recorded occurred in 2002 and measured 8400 square miles
Gulf of Mexico, 1985-2011 • In 2012, it was 2889 mi2
Control of Fertilizer Input • The small 2012 dead zone suggests that a reduction of nitrate input into the Gulf of Mexico would have an immediate impact • In addition to controlling the agricultural and home inputs of fertilizer, is there another way of reducing dead zones?
Natural Fertilizer Buffers • Dr. Scavia has two suggestions: • Building wetlands around the rivers would encourage the natural denitrification that occurs in such ecosystems • Buffering rivers with grasses to absorb the nitrates would also help
Environmental Activism • Green groups have been trying to persuade the Environmental Protection Agency (EPA) to set a limit for the amount of nitrogen and phosphorus allowed in the states whose rivers feed the Mississippi • In March, 2012 members of the Mississippi River Collaborative, an environmental group, filed a lawsuit designed to force all those involved to think about ways to solve the problem
Environmental Pushback • The Federal Water Quality Coalition, a group composed of industrial and metropolitan water users, has launched its own lawsuit in opposition to the first • It argues that the federal government should play no role in setting limits, and furthermore that the very idea of limits is too simplistic
State Action • Wisconsin is one of the few states to introduce, in 2010, statewide numerical limits for phosphorus • Joe Parisi, who runs Dane County, says these have spurred the county into working on new measures with the Madison metropolitan sewerage district
State Ideas • Wisconsin has suggested two ideas • One is an innovative community biodigester that generates power from cattle manure • Another idea is a low-tech effort to extract phosphorus by using crops which are then harvested