Download

1 / 15
150 likes | 270 Views
Development of ATOVS Data Assimilation for Regional Forecast System. Eunjoo Lee NWPD, KMA. Introduction of Regional Forecast System. Insufficient obs. data over the sea. Regional Forecast System( 3hr-cycle run, 10km resolution ). < 24hr Fcst. >. < BG. Field >. < Time(UTC) >. 00. 03.

E N D
Development of ATOVS Data Assimilation for Regional Forecast System Eunjoo Lee NWPD, KMA
Introduction of Regional Forecast System Insufficient obs. data over the sea Regional Forecast System( 3hr-cycle run, 10km resolution ) < 24hr Fcst. > < BG. Field > < Time(UTC) > 00 03 06 09 12 15 21 24 03 …… 18 (D+1 Day ) (D-Day)
1DVAR for Regional Forecast System O NOAA-16, AMSU-A ch4~ch14 , 06UTC/18UTC O Only over the sea and over the clear sky area ( Satellite data over the land or over cloudy area will be removed ) Land mask for 1DVAR removed assimilated
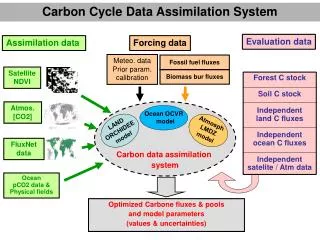
Flow Chart of 1DVAR • Calculated ozone profile • instead of climatological ozone profile Bias correction coeff. - Scan angle corr. - Air mas corr. Bg. Error Obs. Error 1DVAR Analysis (RTV-7) Obs. Increment(O-B) (1-month) F_24 – F_12 (1-month) Bg Fielld(6hr forecast) ( T,q ) Regional 3DVAR Analysis ATOVS Data Regional Model (Resolution : 10km) • ATOVS Data from GTS network • Directreadout ATOVS Data by KMA 24hr Fcst. 결과보기
Directreadout ATOVS Data O Needed to get more satellite obs data O Retrieved by Remote Sensing Devision of KMA and Remote Sensing Lab of METRI Directreadout ATOVS Data (NetCDF format)
Obs data number used 1DVAR Time series for satellite obs data number used in 1DVAR GTS GTS + Direct
TOMS OZONE DATA 1.25 X 1 grid data ZERO value
Reference Ozone Profile at 45N Reference Ozone Profile at 75 N Reference Ozone Profile at 15N Pressure[hPa] Pressure[hPa] Pressure[hPa] Ozone amount[ppmv] Ozone amount[ppmv] Ozone amount[ppmv] REFERENCE OZONE PROFILES Total ozone amount : 125 –175–225–275–325–375–425–475–525 - 575
300 Dobson 45N 45N 275 300 325 Dobson 30N 15N 15N 275 300 325 Dobson HOW TO GET NEW OZONE PROFILE 300 Dobson at 30N
Time series of obs increment AMSUA 4 AMSUA 6 AMSUA 5 AMSUA 7 AMSUA 8 AMSUA 9 AMSUA 10 AMSUA 11 AMSUA 12 AMSUA 14 AMSUA 13
Time series of analysis increment T_1000 T_975 T_925 ( 15-layer Temp. ) T_850 T_800 T_900 T_700 T_500 T_400 T_300 T_200 T_250 T_150 T_100 T_70
Time series of analysis increment ( 11-layer Specific Humidity ) q_1000 T_975 T_925 T_900 T_850 T_800 T_700 T_500 T_400 T_300 T_250
Domain-averaged analysis Profile Analysis Time : 2005053018 6hourly, 10-day run
Obs (2004/08/10/06UTC) Comparison between Obs. & Forecast GOES-9 WV image 3 hr accumulated rain NOAA 16 ATOVS, +12hr 3hr Precip. (valid time : 2004081006) EXP CNTL
Plans Satellite data assimilation • O Level 1C data assimilation • O Direct radiance assimilation in Regional 3DVAR • O Satellite data assimilation over land Regional Forecast System • O Test of 1DVAR Impact on Typhoon forecast