Download
1 / 10
120 likes | 239 Views
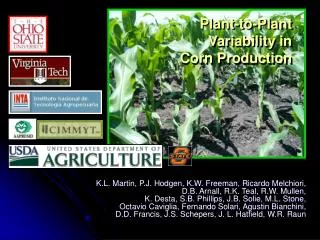
By-Plant Prediction of Corn ( Zea mays L.) Grain Yield Using Optical Sensor Readings and Measured Plant Height. K.L. Martin, W.R. Raun, M.L. Stone, J.B. Solie, K.W. Freeman, B. Tubana, B. Chung, R.K. Teal, D.B. Arnall, K. Desta, S. Moges, C.J. Mack, J.W. Lawless, O. Walsh, S. Holtz, K. Lawless.

E N D
By-Plant Prediction of Corn (Zea mays L.) Grain Yield Using Optical Sensor Readings and Measured Plant Height K.L. Martin, W.R. Raun, M.L. Stone, J.B. Solie, K.W. Freeman, B. Tubana, B. Chung, R.K. Teal, D.B. Arnall, K. Desta, S. Moges, C.J. Mack, J.W. Lawless, O. Walsh, S. Holtz, K. Lawless
This bicycle was modified such that a GreenSeeker™ sensor head, power source, and shaft encoder could be used to determine distance for each NDVI reading recorded in the data file. Measure the distance of each plant’s location Calculate the area that each plant occupies Where: Di is the area occupied by the ith plant di-1,di,di+1 are the distances to the i-1, i, and i+1 plants Average NDVI of each plant By-Plant Prediction of Corn Grain Yield
The unit was pushed along the corn row as illustrated White marker plates were used at the beginning and end of each row to designate the start and stop point The resulting data file included NDVI for each calibrated distance (approximately 1.1 cm) and sonar height (when sonar was used)
Data Presentation Individual data points collected every 1.1 cm Average NDVI for each plant
NDVI vs. Grain Yield at all sites (2003 and 2004) INSEY vs. Grain Yield at all sites where height was recorded
3 4 5 1 2 Do these plants compete with one another? If they do, what above ground parameter(s) can we use to evaluate this? Does the proximity of the competitor have an impact on the level of competition?
Plant Competition Equation In a series of five plants, the height of plant number 2 and 4 is compared to the average of the height of their neighbors to assess the competitive ability of plants 2 and 4 as compared to the plant in question, plant 3. This value generated from the first step of this process (weighted average value of plant 2 and 4 in the series) is then compared to the actual height of plant 3 to result in a weighted comparison of the competitive ability of plant 3 to its neighbors
GYest is the estimated grain yield Cadj is the competition adjustment factor D is the linear distance occupied by each plant INSEY is the in-season estimate of yield The competition adjustment factor accounts for the competitive ability of the plant in question when considering its height against those that surround it. This value is then divided by the linear distance to adjust the index due to the change in proximity of the competitive plants (a closer proximity to the competitive plant will divide by a smaller number resulting in more emphasis being placed on the height comparison). The resulting value is then multiplied by INSEY to allow for an incorporation of biomass produced per day.
By-Plant Prediction of Corn Grain Yield Yield Prediction Using INSEY Yield Prediction Using GYest