Download
1 / 12
130 likes | 238 Views
Global demand for activated carbon is on an upswing, with prospects for future growth looking quite healthy. Activated carbon?s outstanding capability in adsorbing a number of impurities from liquids and gases renders it to be used on an extensive basis in several applications concerning air and water purification. Additional application areas for the material include the automotive, food & beverage and medical & pharmaceutical industries, albeit on a limited basis. The future market for activated carbon is also likely to derive benefit from a continuous stream of openings from a number of industrial processes that employ adsorption technologies.<br><br>Regulations related to water and air pollution across the world have a major role to play in influencing demand for activated carbon. Several countries across the globe are confronting the challenge of depleting clean water resources due to growing population. Rising levels of contaminated groundwater need purification and activated carbon offers a potent solution for overcoming this hurdle. The Disinfectants and Disinfection Byproducts Rule in the United States that puts a cap on the allowable concentration of chemicals in drinking water is also likely to drive growth for activated carbon.<br><br>The supply of raw material for activated carbon has been tight and producers have been compelled to increase prices of virgin activated carbon. This scenario has led to fueling demand for reactivated carbon in various areas, such as refineries for reducing VOCs in gas phase applications, groundwater remediation and wastewater treatment processes.<br><br>Worldwide market for Activated Carbon product segments explored in this study includes Granular Activated Carbon, Powdered Activated Carbon and Other Activated Carbons. The report also analyzes the key applications of Activated Carbon comprising Gas Phase applications and Liquid Phase applications while discussing the major end-use sector markets covering Air Purification, Automotive Canisters, Food & Beverages, Medical & Pharmaceutical, Water Treatment and Others. The global markets for the above mentioned product types, application areas and end-use sectors are analyzed in terms of both in metric tons and USD. Global market for activated carbon, estimated at US$2.7 billion in 2015, forecast at US$3 billion in 2016 and further expected to maintain a robust CAGR of 12.8% between 2016 and 2022 to reach a projected US$6.2 billion by 2022.<br><br>This report reviews, analyses and projects the activated carbon market for the period 2012-2022 globally and the regional markets including North America, Europe, Asia-Pacific, South America and Rest of World. The regional markets further analyzed for 15 independent countries across North America – The United States, Canada and Mexico; Europe – France, Germany, Italy, Spain, Russia and the United Kingdom; Asia-Pacific – China, India, Japan and South Korea; South America – Argentina and Brazil.<br><br>This 585 page global market research report includes 367 charts (includes a data table and graphical representation for each chart), supported with meaningful and easy to understand graphical presentation, of market numbers. This report profiles 49 key global players and 80 major players across North America – 22; Europe – 8; Asia-Pacific – 49; and South America 1. The research also provides the listing of the companies engaged in manufacturing and supply of Activated Carbon. The global list of companies covers the address, contact numbers and the website addresses of 227 companies.

E N D
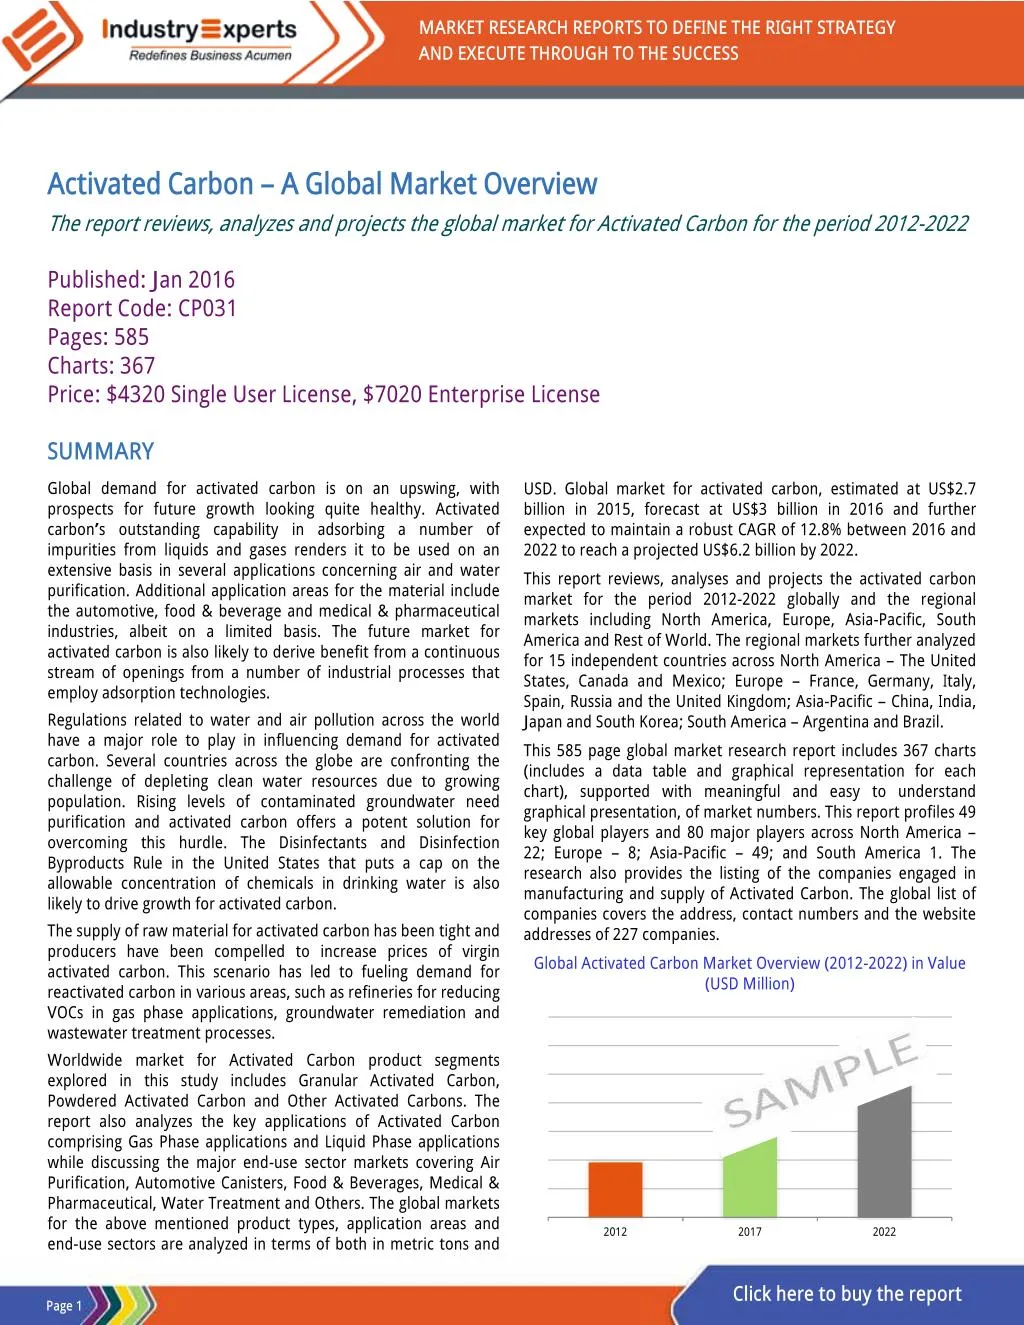
MARKET RESEARCH REPORTS TO DEFINE THE RIGHT STRATEGY AND EXECUTE THROUGH TO THE SUCCESS Activated Carbon – A Global Market Overview The report reviews, analyzes and projects the global market for Activated Carbon for the period 2012-2022 Published: Jan 2016 Report Code: CP031 Pages: 585 Charts: 367 Price: $4320 Single User License, $7020 Enterprise License SUMMARY Global demand for activated carbon is on an upswing, with prospects for future growth looking quite healthy. Activated carbon’s outstanding capability in adsorbing a number of impurities from liquids and gases renders it to be used on an extensive basis in several applications concerning air and water purification. Additional application areas for the material include the automotive, food & beverage and medical & pharmaceutical industries, albeit on a limited basis. The future market for activated carbon is also likely to derive benefit from a continuous stream of openings from a number of industrial processes that employ adsorption technologies. Regulations related to water and air pollution across the world have a major role to play in influencing demand for activated carbon. Several countries across the globe are confronting the challenge of depleting clean water resources due to growing population. Rising levels of contaminated groundwater need purification and activated carbon offers a potent solution for overcoming this hurdle. The Disinfectants and Disinfection Byproducts Rule in the United States that puts a cap on the allowable concentration of chemicals in drinking water is also likely to drive growth for activated carbon. The supply of raw material for activated carbon has been tight and producers have been compelled to increase prices of virgin activated carbon. This scenario has led to fueling demand for reactivated carbon in various areas, such as refineries for reducing VOCs in gas phase applications, groundwater remediation and wastewater treatment processes. Worldwide market for Activated Carbon product segments explored in this study includes Granular Activated Carbon, Powdered Activated Carbon and Other Activated Carbons. The report also analyzes the key applications of Activated Carbon comprising Gas Phase applications and Liquid Phase applications while discussing the major end-use sector markets covering Air Purification, Automotive Canisters, Food & Beverages, Medical & Pharmaceutical, Water Treatment and Others. The global markets for the above mentioned product types, application areas and end-use sectors are analyzed in terms of both in metric tons and USD. Global market for activated carbon, estimated at US$2.7 billion in 2015, forecast at US$3 billion in 2016 and further expected to maintain a robust CAGR of 12.8% between 2016 and 2022 to reach a projected US$6.2 billion by 2022. This report reviews, analyses and projects the activated carbon market for the period 2012-2022 globally and the regional markets including North America, Europe, Asia-Pacific, South America and Rest of World. The regional markets further analyzed for 15 independent countries across North America – The United States, Canada and Mexico; Europe – France, Germany, Italy, Spain, Russia and the United Kingdom; Asia-Pacific – China, India, Japan and South Korea; South America – Argentina and Brazil. This 585 page global market research report includes 367 charts (includes a data table and graphical representation for each chart), supported with meaningful and easy to understand graphical presentation, of market numbers. This report profiles 49 key global players and 80 major players across North America – 22; Europe – 8; Asia-Pacific – 49; and South America 1. The research also provides the listing of the companies engaged in manufacturing and supply of Activated Carbon. The global list of companies covers the address, contact numbers and the website addresses of 227 companies. Global Activated Carbon Market Overview (2012-2022) in Value (USD Million) 2012 2017 2022 Click here to buy the report Page 1
Activated Carbon – A Global Market Overview Jan 2016 |585 Pages | 367 Charts | Price $4320 SAMPLE COMPANY PROFILE SAMPLE TABLE/CHART Glance at 2017 Global Activated Carbon Volume Market Share (%) by End-Use Sector – Air Purification, Automotive Canisters, Food & Beverages, Medical & Pharmaceutical, Water Treatment and Others ADA CARBON SOLUTIONS, LLC (UNITED STATES) 1460 W. Canal Court Littleton Colorado 80120-5632, United States Phone: 303-962-1977 Fax: 866-316-5553 Website: www.ada-cs.com Business Overview ADA Carbon Solutions, LLC was established in 2008 with headquarters in Colorado, United States and is a leading provider of activated carbon products designed for optimal mercury removal in emission control applications. The company is engaged in the research, development, and supply of powdered activated carbons mainly for various industrial sectors such as power generation (comprising renewable energy facilities), electric transmission, midstream gas (encompassing gas storage, pipelines and other related assets), and other infrastructure assets (like coal transportation, handling and reserves, and energy service companies). Global Granulated Activated Carbon (GAC) Market Analysis (2012-2022) by Geographic Region – North America, Europe, Asia-Pacific, South America and Rest of World in '000 Metric Tons Product Portfolio Product PowerPAC™ Particulars Is a high quality powdered activated carbon (PAC) used to capture and control mercury in halogen-containing flue gas; optimized for flue gas mercury capture and sequestration Is a halogenated powdered activated carbon (PAC) mainly designed for effective flue gas mercury removal in low-halogen applications such as powder river basin coals, lignite coals, and biomass Is a halogenated PAC integrated with advanced halogen treatment for enhancing the oxidation of mercury and offer optimized mercury control in more-challenging low- halogen flue gas applications Includes FastPAC™ and the brominated FastPAC Premium™; patent-pending, next- generation powdered activated carbons designed for quick and efficient removal of mercury from the flue gas of power plants and other coal-fired facilities Is a patent-pending next-generation non- brominated coal and lignite feedstock based PAC designed for quick and efficient mercury removal from the flue gas of power plants and other coal-fired units, especially in systems with pre-oxidized mercury Is a patent-pending halogenated PAC designed for quick and efficient mercury capture from the flue gas of power plants and other coal-fired units, especially in systems with a need for effective oxidation of mercury PowerPAC Premium® 2012 2017 2022 KEY PLAYERS PROFILED •Activated Carbon Technologies Pty Ltd •Active Char Products Pvt. Ltd. •ADA Carbon Solutions, LLC •Advanced Emissions Solutions, Inc •Albemarle Corporation •Arkema S.A. •Asbury Carbons Incorporated •Cabot Corporation •Calgon Carbon Corporation •Clarimex •CPL Carbon Link Limited •Desotec N.V.-S.A. •Donau Chemie AG •Golden Lake Carbon Co., Ltd •Goldstar Carbon Tech Inc. •Hayleys PLC •Kalpaka Chemicals Private Limited •Osaka Gas Chemicals Co., Ltd. •Oxbow Carbon Llc •Pacific Activated Carbon Company •Philippine-Japan Active Carbon Corporation PowerPAC Premium Plus™ FastPAC™ Series FastPAC™ FastPAC Premium® next-generation …………………….more …………………….more Click here to buy the report Page 2
Activated Carbon – A Global Market Overview Jan 2016 |585 Pages | 367 Charts | Price $4320 TABLE OF CONTENTS 2.3.5.1 Drinking Water Treatment ........................... 23 2.3.5.2 Effluent Water Treatment ............................ 24 2.3.6 Other Activated Carbon End-Use Sectors ....... 25 Chart 8: Trending of Activated Carbon Global Consumption in Other Activated Carbon End-Use Sectorss (2015-2020) in Thousand Metric Tons ............................ 25 2.3.6.1 Carbon Dioxide Purification ......................... 25 2.3.6.2 Catalyst ........................................................ 25 2.3.6.3 Cigarette Filters............................................ 26 2.3.6.4 Gas Storage and Delivery ............................. 26 2.3.6.5 Hydrogen Purification by Pressure Swing Adsorption (PSA)...................................................... 26 2.3.6.6 Liquid Chemicals .......................................... 26 2.3.6.7 Removal of Mercury from Natural Gas ........ 27 2.3.6.8 Solvent Recovery ......................................... 27 3. KEY MARKET TRENDS ........................................ 28 3.1 Natural Sources for Producing Activated Carbon Gaining Wider Attention .......................................... 28 3.2 Prospects for Energy Storage Enhanced with New Carbon Developed ................................................... 30 3.3 Activated Carbon Cloths Gaining in Importance 31 3.4 Activated Carbon Fibers (ACFs) for Toluene Adsorption in Respiratory Protection ...................... 32 3.5 Powdered Activated Carbon Scores Over Ozone in Treatment of Micropollutants in Municipal Wastewater ............................................................. 33 3.6 Iron-Coated Activated Carbon for Removing Humic Acid from Water ........................................... 34 Pacific Activated Carbon Company (Philippines) ............. 94 Philippine-Japan Active Carbon Corporation (Philippines) . 95 Pt. Intan Prima Group (Indonesia) .................................. 96 Shanghai Mebao Activated Carbon Co., Ltd. (China) ....... 97 Shanghai Xing Chang Activated Carbon Co., Ltd. (China) 98 Shanxi Xinhua Chemical Co., Ltd. (China) ........................ 99 Shinkwang Chemical Industry Co., Ltd. (South Korea) .. 100 5. KEY BUSINESS TRENDS .................................... 101 Calgon Carbon Inks Three Multi-Year Deals to Supply FLUEPAC® PAC Products for Effective Control of Mercury Emissions ..................................................................... 101 ADES to Enhance its Endeavours on Core Strengths to Meet Emerging DSI Market Demands ........................... 101 MWV Specialty Chemicals Division Changes Name to Ingevity ......................................................................... 101 Global Price Raise of Cabot's Activated Carbon Products 102 Oxbow Activated Carbon LLC Takes Over Superior Adsorbents' Assets ....................................................... 102 Kuraray Presents Activated Carbon-Based Water Treatment Technologies at INDO WATER 2015 ............ 102 American Chemistry Council Awards Certificates of Excellence for Three US Production Units of Cabot ...... 102 Calgon Carbon Receives a Three-Year Supply Deal ....... 103 Calgon Carbon's Granular Activated Carbons Applied to Treat Harmful Algal Toxins ........................................... 103 Tulsa's Best Tasting Water Purified Using Cabot's Granular Activated Carbons ....................................................... 103 Water Quality Association Certifies Jacobi Carbon's Nattandiya Manufacturing Facility ............................... 103 Cabot Offers DARCO® Activated Carbons to Control Mercury Emissions at Two US Power Utilities ............... 104 Cabot's New Segment Structure Enhances Efficiency and Resource Prioritization ................................................. 104 Carbon Activated Group Expands its Activated Carbon Business ........................................................................ 104 Release of Cabot's First Multimedia Activated Carbon Product ......................................................................... 104 Inauguration of Cabot's Novel Mine in Texas ............... 105 Cabot's DARCO® Hg Family of Activated Carbon Products Supplied to Two US Electric Utilities ............................ 105 Calgon Carbon and Samsung C&T Corporation Form Filtrasorb® GAC Supply Pact ......................................... 105 Integration of Japan EnviroChemicals and Osaka Gas Chemicals ..................................................................... 105 Cabot and Westmoreland to Broaden their Footprint in North America ............................................................. 106 Arkema Presents Acticarbone® and Anticromos® Activated Carbons at the CPhl 2014 Trade Show .......................... 106 Launch of Chemviron Carbon's New MACH4 and MACH4S Mobile Activated Carbon Filters for the Biogas Industry106 Calgon Carbon and Palmadale Water District form GAC Supply Pact for Ten Years ............................................. 106 Carbon Resources Acquired by Oxbow ......................... 107 Calgon Carbon's Novel GAC Reactivated Facility in New York .............................................................................. 107 CarboTech's Establishes Subsidiary in Italy ................... 107 AMC Recognizes Calgon Carbon's Facility in Gila Bend, Arizona for Sustainability Excellence ............................ 107 Calgon Carbon to Offer GACs to Gu Eui Water Plant in Seoul ............................................................................ 108 Japan EnviroChemicals Signs MOU with Tancarb .......... 108 Dutch Drinking Water Industry Receives Kiwa-ATA/ATD Certified Activated Carbons from Chemviron Carbon ... 108 Calgon Carbon to Offer Reactivated GACs for Drinking Water Treatment in the City of Glendale, Arizona ........ 108 Jacobi Carbons Acquired by Osaka Gas Chemicals ........ 109 Kuraray Group to Exhibit Activated Carbon for Aqua Business at VIETWATER 2013 ....................................... 109 Calgon Carbon and Brenntag Procure Supply Deal ....... 109 Thames Water and Chemviron Sign Supply Deal for Reactivated Carbons to Treat Drinking Water .............. 110 US PTO Issues Fifth Patent for Calgon Carbon's Advanced FLUEPAC® Technology .................................................. 110 Inauguration of Calgon Carbon's Custom Carbon Reactivation Facility in Gila Bend, Arizona .................... 110 PART A: GLOBAL MARKET PERSPECTIVE ........ 1 1. INTRODUCTION .................................................. 1 1.1 Product Outline .................................................... 3 1.1.1 What is Activated Carbon? ............................... 3 1.1.2 Manufacture of Activated Carbon .................... 3 1.1.2.1 Steam Activation ............................................ 3 1.1.2.2 Chemical Activation ....................................... 4 1.1.3 Properties of Activated Carbon ......................... 4 Table 1: Some of the Commonly Measured Properties of Activated Carbon ............................................................... 5 Table 2: Typical Properties of Activated Carbons Manufactured using Various Raw Materials ...................... 5 1.1.4 The Principle of Activated Carbon’s functioning 5 1.1.5 The Need for Different Activated Carbons ........ 6 1.1.6 Classification of Activated Carbons ................... 7 1.1.6.1 Granulated Activated Carbon (GAC) .............. 7 1.1.6.2 Powdered Activated Carbon (PAC) ................ 8 1.1.6.3 Other Activated Carbons ................................ 8 1.1.6.3.1 Bead Activated Carbon ............................... 8 1.1.6.3.2 Extruded/Pelleted Activated Carbon .......... 9 1.1.6.3.3 Impregnated Activated Carbon ................... 9 1.1.6.3.4 Polymer Coated Activated Carbon .............. 9 2. APPLICATION ANALYSIS – A SNAPSHOT ............. 10 2.1 Gas Phase Applications ...................................... 10 Chart 1: Trending of Activated Carbon Global Consumption in Gas Phase Applications (2015-2020) in Thousand Metric Tons ..................................................... 10 2.2 Liquid Phase Applications .................................. 12 Chart 2: Trending of Activated Carbon Global Consumption in Liquid Phase Applications (2015-2020) in Thousand Metric Tons ..................................................... 12 2.3 End-Uses of Activated Carbon ........................... 13 2.3.1 Air Purification ................................................ 13 Chart 3: Trending of Activated Carbon Global Consumption in Air Purification Sector (2015-2020) in Thousand Metric Tons ..................................................... 13 2.3.1.1 Hydrogen Sulfide and Odor Control ............. 14 2.3.1.1.1 Flue Gas .................................................... 15 2.3.1.1.2 Removal of Toxic Inorganic Compounds ... 15 2.3.1.1.3 Biogas Purification .................................... 15 2.3.2 Automotive Canisters ..................................... 16 Chart 4: Trending of Activated Carbon Global Consumption in Automotive Sector (2015-2020) in Thousand Metric Tons ..... 16 2.3.3 Food & Beverages ........................................... 17 Chart 5: Trending of Activated Carbon Global Consumption in Food & Beverages Sector (2015-2020) in Thousand Metric Tons ..................................................... 17 2.3.3.1 Brewing and Bottling ................................... 18 Table 3: Summary of Beverage Applications of Activated Carbons ........................................................................... 18 2.3.3.2 Decaffeination ............................................. 18 2.3.3.2.1 Treatment of Edible Oils ........................... 19 2.3.3.2.2 Purification of Glycerin ............................. 19 2.3.3.2.3 Sugar and Natural and Synthetic Sweeteners ........ 19 2.3.4 Medical & Pharmaceutical .............................. 20 Chart 6: Trending of Activated Carbon Global Consumption in Medical & Pharmaceutical Sector (2015- 2020) in Thousand Metric Tons ....................................... 20 2.3.4.1 Active Pharmaceutical Ingredients (APIs) .... 21 2.3.4.2 Vitamins ....................................................... 21 2.3.4.3 Enzymes ....................................................... 22 2.3.4.4 Penicillin ....................................................... 22 2.3.4.5 Painkillers ..................................................... 22 2.3.4.6 Contrast media /Intravenous Solutions ....... 22 2.3.5 Water Treatment ............................................ 23 Chart 7: Trending of Activated Carbon Global Consumption in Water Treatment Sector (2015-2020) in Thousand Metric Tons ..................................................... 23 4. KEY GLOBAL PLAYERS ........................................ 35 Activated Carbon Technologies Pty Ltd (Australia) .......... 35 Active Char Products Pvt. Ltd. (India) .............................. 36 Ada Carbon Solutions, Llc (United States) ....................... 37 Advanced Emissions Solutions, Inc. (United States) ........ 38 Albemarle Corporation (United States) ........................... 39 Arkema S.A. (France) ....................................................... 41 Asbury Carbons Incorporated (United States) ................. 42 Babcock Power Inc. (United States) ................................ 43 Boyce Carbon (India) ....................................................... 44 Cabot Corporation (United States) .................................. 45 Calgon Carbon Corporation (United States) .................... 49 Capital Carbon (India) ..................................................... 55 Carbochem Inc. (United States) ...................................... 56 Carbon Activated Corp. (United States) .......................... 57 Clarimex (Mexico) ........................................................... 58 Cpl Carbon Link Limited (United Kingdom) ...................... 59 Datong Coal Jinding Activated Carbon Co. Ltd. (China) ... 60 Datong Municipal Yunguang Activated Carbon Co., Ltd. (China) ..... 61 Desotec N.V.-S.A. (Belgium) ............................................ 62 Donau Chemie Ag (Austria) ............................................. 64 Evoqua Water Technologies Llc (United States) .............. 65 Fujian Xinsen Carbon Co. Ltd. (China) ............................. 68 Fujian Yuanli Active Carbon Industrial Co., Ltd. (China) ... 69 Fujian Zhixing Activated Carbon Co., Ltd. (China) ............ 70 Futamura Chemical Co., Limited (Japan) ......................... 72 Golden Lake Carbon Co., Ltd (China) ............................... 73 Goldstar Carbon Tech Inc. (Taiwan) ................................ 74 Hangzhou Hengxing Activated Carbon Co., Ltd. (China) .. 75 Hayleys Plc (Sri Lanka) ..................................................... 76 Indo German Carbons Limited (India) ............................. 77 Ingevity (United States) ................................................... 78 Jayeon Science Industry Co., Ltd. (South Korea) .............. 79 Jiangsu Zhuxi Activated Carbon Co., Ltd. (China) ............. 80 Kalpaka Chemicals Private Limited (India) ....................... 82 Kan-Carbon Private Limited (India) ................................. 84 Kuraray Co., Ltd. (Japan) ................................................. 85 Kureha Corporation (Japan) ............................................ 86 Ningxia Guanghua-Cherishmet Activated Carbon Co., Ltd. (China) ..... 87 Ningxia Huahui Activated Carbon Company Limited (China) ........... 88 Nucon International, Inc. (United States) ........................ 89 Osaka Gas Chemicals Co., Ltd. (Japan) ............................ 91 Oxbow Carbon Llc (United States) ................................... 93 Click here to buy the report Page 3
Activated Carbon – A Global Market Overview Jan 2016 |585 Pages | 367 Charts | Price $4320 Calgon Carbon to Offer FLUEPAC® Brominated PACs to Control Mercury Emissions in the Midwest Power Plants .... 111 JEC and CarboTech Conclude Supply Distributorship Agreement for Nitrogen-CMS ........................................ 111 ADA Carbon Solutions Established Long Term Collaboration with Covanta .......................................... 111 BlueScope Selects CCJ to Deliver Activated Carbon for Pollution Control Needs ................................................ 111 Acquisition of Bulk Conveyor Specialist Inc. by ADA ...... 112 Launch of ADA's New, Patent Pending FastPAC™ Series of Activated Carbon Products ............................................ 112 Calgon Carbon to Offer Reactivated Carbon for Drinking Water Treatment to the City of Scottsdale .................... 112 Chemviron Develops Zorflex® VB and Zorflex® VB Plus Activated Carbon Cloth Types ....................................... 113 6. GLOBAL MARKET OVERVIEW........................... 114 Chart 9: Global Activated Carbon Market Overview (2012-2022) in Volume ('000 Metric Tons) and Value (USD Million).............. 114 6.1 Global Activated Carbon Market Overview by Product Segment ................................................... 115 Volume Analysis ..................................................... 115 Chart 10: Global Activated Carbon Market Analysis (2012- 2022) by Product Segment – Granular Activated Carbon (GAC), Powdered Activated Carbon (PAC) and Other Activated Carbons in '000 Metric Tons .......................... 115 Chart 11: Glance at 2012, 2017 and 2022 Global Activated Carbon Volume Market Share (%) by Product Segment – Granular Activated Carbon (GAC), Powdered Activated Carbon (PAC) and Other Activated Carbons .................. 116 6.1.1 Global Activated Carbon Volume Product Segment Overview by Geographic Region ............. 117 6.1.1.1 Granulated Activated Carbon (GAC) .......... 117 Chart 12: Global Granulated Activated Carbon (GAC) Market Analysis (2012-2022) by Geographic Region – North America, Europe, Asia-Pacific, South America and Rest of World in '000 Metric Tons ................................. 117 Chart 13: Glance at 2012, 2017 and 2022 Global Granulated Activated Carbon (GAC) Volume Market Share (%) by Geographic Region – North America, Europe, Asia- Pacific, South America and Rest of World...................... 118 6.1.1.2 Powdered Activated Carbon (PAC) ............ 119 Chart 14: Global Powdered Activated Carbon (PAC) Market Analysis (2012-2022) by Geographic Region – North America, Europe, Asia-Pacific, South America and Rest of World in '000 Metric Tons ............................................. 119 Chart 15: Glance at 2012, 2017 and 2022 Global Powdered Activated Carbon (PAC) Volume Market Share (%) by Geographic Region – North America, Europe, Asia-Pacific, South America and Rest of World ................................. 120 6.1.1.3 Other Activated Carbons ............................ 121 Chart 16: Global Other Activated Carbons Market Analysis (2012- 2022) by Geographic Region – North America, Europe, Asia-Pacific, South America and Rest of World in '000 Metric Tons .................. 121 Chart 17: Glance at 2012, 2017 and 2022 Global Other Activated Carbons Volume Market Share (%) by Geographic Region – North America, Europe, Asia-Pacific, South America and Rest of World ................................. 122 Value Analysis ........................................................ 123 Chart 18: Global Activated Carbon Market Analysis (2012- 2022) by Product Segment – Granular Activated Carbon (GAC), Powdered Activated Carbon (PAC) and Other Activated Carbons in USD Million .................................. 123 Chart 19: Glance at 2012, 2017 and 2022 Global Activated Carbon Value Market Share (%) by Product Segment – Granular Activated Carbon (GAC), Powdered Activated Carbon (PAC) and Other Activated Carbons .................. 124 6.1.2 Global Activated Carbon Volume Product Segment Overview by Geographic Region ............. 125 6.1.2.1 Granulated Activated Carbon (GAC) .......... 125 Chart 20: Global Granulated Activated Carbon (GAC) Market Analysis (2012-2022) by Geographic Region – North America, Europe, Asia-Pacific, South America and Rest of World in USD Million ......................................... 125 Chart 21: Glance at 2012, 2017 and 2022 Global Granulated Activated Carbon (GAC) Value Market Share (%) by Geographic Region – North America, Europe, Asia- Pacific, South America and Rest of World...................... 126 6.1.2.2 Powdered Activated Carbon (PAC) ............ 127 Chart 22: Global Powdered Activated Carbon (PAC) Market Analysis (2012-2022) by Geographic Region – North America, Europe, Asia-Pacific, South America and Rest of World in USD Million ..................................................... 127 Chart 23: Glance at 2012, 2017 and 2022 Global Powdered Activated Carbon (PAC) Value Market Share (%) by Geographic Region – North America, Europe, Asia-Pacific, South America and Rest of World ................................. 128 6.1.2.3 Other Activated Carbons ............................ 129 Chart 24: Global Other Activated Carbons Market Analysis (2012-2022) by Geographic Region – North America, Europe, Asia-Pacific, South America and Rest of World in USD Million ................................................................... 129 Chart 25: Glance at 2012, 2017 and 2022 Global Other Activated Carbons Value Market Share (%) by Geographic Region – North America, Europe, Asia-Pacific, South America and Rest of World ........................................... 130 6.2 Global Activated Carbon Market Overview by Application............................................................. 131 Volume Analysis..................................................... 131 Chart 26: Global Activated Carbon Market Analysis (2012- 2022) by Application – Gas Phase and Liquid Phase in '000 Metric Tons ................................................................... 131 Chart 27: Glance at 2012, 2017 and 2022 Global Activated Carbon Volume Market Share (%) by Application – Gas Phase and Liquid Phase ................................................. 132 6.2.1 Global Activated Carbon Volume Application Overview by Geographic Region ............................ 133 6.2.1.1 Gas Phase Applications .............................. 133 Chart 28: Global Activated Carbon Market in Gas Phase Applications Analysis (2012-2022) by Geographic Region – North America, Europe, Asia-Pacific, South America and Rest of World in '000 Metric Tons ................................. 133 Chart 29: Glance at 2012, 2017 and 2022 Global Activated Carbon Volume Market Share (%) in Gas Phase Applications by Geographic Region – North America, Europe, Asia-Pacific, South America and Rest of World 134 6.2.1.2 Liquid Phase Applications .......................... 135 Chart 30: Global Activated Carbon Market in Liquid Phase Applications Analysis (2012-2022) by Geographic Region – North America, Europe, Asia-Pacific, South America and Rest of World in '000 Metric Tons ................................. 135 Chart 31: Glance at 2012, 2017 and 2022 Global Activated Carbon Volume Market Share (%) in Liquid Phase Applications by Geographic Region – North America, Europe, Asia-Pacific, South America and Rest of World 136 Value Analysis ........................................................ 137 Chart 32: Global Activated Carbon Market Analysis (2012- 2022) by Application – Gas Phase and Liquid Phase in USD Million ........................................................................... 137 Chart 33: Glance at 2012, 2017 and 2022 Global Activated Carbon Value Market Share (%) by Application – Gas Phase and Liquid Phase ........................................................... 138 6.2.2 Global Activated Carbon Value Application Overview by Geographic Region ............................ 139 6.2.2.1 Gas Phase Applications .............................. 139 Chart 34: Global Activated Carbon Market in Gas Phase Applications Analysis (2012-2022) by Geographic Region – North America, Europe, Asia-Pacific, South America and Rest of World in '000 Metric Tons ................................. 139 Chart 35: Glance at 2012, 2017 and 2022 Global Activated Carbon Value Market Share (%) in Gas Phase Applications by Geographic Region – North America, Europe, Asia- Pacific, South America and Rest of World ..................... 140 6.2.2.2 Liquid Phase Applications .......................... 141 Chart 36: Global Activated Carbon Market in Liquid Phase Applications Analysis (2012-2022) by Geographic Region – North America, Europe, Asia-Pacific, South America and Rest of World in '000 Metric Tons ................................. 141 Chart 37: Glance at 2012, 2017 and 2022 Global Activated Carbon Value Market Share (%) in Liquid Phase Applications by Geographic Region – North America, Europe, Asia-Pacific, South America and Rest of World 142 6.3 Global Activated Carbon Market Overview by End- Use Sector.............................................................. 143 Volume Analysis .................................................... 143 Chart 38: Global Activated Carbon Market Analysis (2012- 2022) by End-Use Sector – Air Purification, Automotive Canisters, Food & Beverages, Medical & Pharmaceutical, Water Treatment and Others in '000 Metric Tons ........ 143 Chart 39: Glance at 2012, 2017 and 2022 Global Activated Carbon Volume Market Share (%) by End-Use Sector – Air Purification, Automotive Canisters, Food & Beverages, Medical & Pharmaceutical, Water Treatment and Others ................. 144 6.3.1 Global Activated Carbon Volume Application Overview by Geographic Region ............................ 145 6.3.1.1 Air Purification ........................................... 145 Chart 40: Global Activated Carbon in Air Purification Market Analysis (2012-2022) by Geographic Region – North America, Europe, Asia-Pacific, South America and Rest of World in '000 Metric Tons ................................ 145 Chart 41: Glance at 2012, 2017 and 2022 Global Activated Carbon Air Purification Volume Market Share (%) by Geographic Region in – North America, Europe, Asia- Pacific, South America and Rest of World ..................... 146 6.3.1.2 Automotive Canisters ................................ 147 Chart 42: Global Activated Carbon in Automotive Canisters Market Analysis (2012-2022) by Geographic Region – North America, Europe, Asia-Pacific, South America and Rest of World in '000 Metric Tons ................................ 147 Chart 43: Glance at 2012, 2017 and 2022 Global Activated Carbon in Automotive Canisters Volume Market Share (%) by Geographic Region – North America, Europe, Asia- Pacific, South America and Rest of World ..................... 148 6.3.1.3 Food & Beverages ...................................... 149 Chart 44: Global Activated Carbon in Food & Beverages Market Analysis (2012-2022) by Geographic Region – North America, Europe, Asia-Pacific, South America and Rest of World in '000 Metric Tons ................................ 149 Chart 45: Glance at 2012, 2017 and 2022 Global Activated Carbon in Food & Beverages Volume Market Share (%) by Geographic Region – North America, Europe, Asia-Pacific, South America and Rest of World ................................. 150 6.3.1.4 Medical & Pharmaceutical ......................... 151 Chart 46: Global Activated Carbon in Medical & Pharmaceutical Market Analysis (2012-2022) by Geographic Region – North America, Europe, Asia-Pacific, South America and Rest of World in '000 Metric Tons . 151 Chart 47: Glance at 2012, 2017 and 2022 Global Activated Carbon in Food & Beverages Volume Market Share (%) by Geographic Region – North America, Europe, Asia-Pacific, South America and Rest of World ................................. 152 6.3.1.5 Water Treatment ....................................... 153 Chart 48: Global Activated Carbon in Water Treatment Market Analysis (2012-2022) by Geographic Region – North America, Europe, Asia-Pacific, South America and Rest of World in '000 Metric Tons ................................ 153 Chart 49: Glance at 2012, 2017 and 2022 Global Activated Carbon in Water Treatment Volume Market Share (%) by Geographic Region – North America, Europe, Asia-Pacific, South America and Rest of World ................................. 154 6.3.1.6 Other Activated Carbon End-Use Sectors .. 155 Chart 50: Global Activated Carbon in Other Activated Carbon End-Use Sectors Market Analysis (2012-2022) by Geographic Region – North America, Europe, Asia-Pacific, South America and Rest of World in '000 Metric Tons . 155 Chart 51: Glance at 2012, 2017 and 2022 Global Activated Carbon in Other Activated Carbon End-Use Sectors Volume Market Share (%) by Geographic Region – North America, Europe, Asia-Pacific, South America and Rest of World ........................................................................... 156 Value Analysis ........................................................ 157 Chart 52: Global Activated Carbon Market Analysis (2012- 2022) by End-Use Sector – Air Purification, Automotive Canisters, Food & Beverages, Medical & Pharmaceutical, Water Treatment and Others in USD Million ................ 157 Chart 53: Glance at 2012, 2017 and 2022 Global Activated Carbon Value Market Share (%) by End-Use Sector – Air Purification, Automotive Canisters, Food & Beverages, Medical & Pharmaceutical, Water Treatment and Others ................. 158 6.3.2 Global Activated Carbon Value Application Overview by Geographic Region ............................ 159 Click here to buy the report Page 4
Activated Carbon – A Global Market Overview Jan 2016 |585 Pages | 367 Charts | Price $4320 Chart 87: Glance at 2012, 2017 and 2022 North American Activated Carbon Value Market Share (%) by End-Use Sector – Air Purification, Automotive Canisters, Food & Beverages, Medical & Pharmaceutical, Water Treatment and Others .................................................................... 192 1.5 Major Market Players ...................................... 193 Ada Carbon Solutions, Llc (United States) ..................... 193 Advanced Emissions Solutions, Inc. (United States) ...... 194 Ada-Es, Inc. (United States) ...................................... 195 Albemarle Corporation (United States) ........................ 197 Asbury Carbons Incorporated (United States) .............. 199 Babcock Power Inc. (United States) .............................. 200 Cabot Corporation (United States) ............................... 201 Cabot Norit Activated Carbon Americas (United States) ......... 205 Calgon Carbon Corporation (United States) .................. 206 Chemviron Carbon (Belgium) ................................... 212 California Carbon Co., Inc. (United States) .................... 214 Cameron Great Lakes, Inc. (United States) ................... 215 Carbochem Inc. (United States) .................................... 216 Carbon Activated Corp. (United States) ........................ 217 Clarimex (Mexico) ......................................................... 218 Evoqua Water Technologies Llc (United States) ........... 219 Ingevity (United States) ................................................ 222 Purification Cellutions, Llc (United States) ............... 223 Nucon International, Inc. (United States) ..................... 224 Oxbow Carbon Llc (United States) ................................ 226 Oxbow Activated Carbon Llc (United States) ............ 227 Standard Purification Llc (United States) ...................... 228 1.6 North American Activated Carbon Market Overview by Country ............................................. 229 1.6.1 The United States ....................................... 229 1.6.1.1 Activated Carbon Market Overview by Product Segment ................................................................ 229 Volume Analysis .................................................... 229 Chart 88: United States Activated Carbon Market Analysis (2012-2022) by Product Segment – Granular Activated Carbon (GAC), Powdered Activated Carbon (PAC) and Other Activated Carbons in '000 Metric Tons ............... 229 Chart 89: Glance at 2012, 2017 and 2022 United States Activated Carbon Volume Market Share (%) by Product Segment – Granular Activated Carbon (GAC), Powdered Activated Carbon (PAC) and Other Activated Carbons .. 230 Value Analysis ........................................................ 231 Chart 90: United States Activated Carbon Market Analysis (2012-2022) by Product Segment – Granular Activated Carbon (GAC), Powdered Activated Carbon (PAC) and Other Activated Carbons in USD Million ....................... 231 Chart 91: Glance at 2012, 2017 and 2022 United States Activated Carbon Value Market Share (%) by Product Segment – Granular Activated Carbon (GAC), Powdered Activated Carbon (PAC) and Other Activated Carbons .. 232 1.6.1.2 Activated Carbon Market Overview by Application ............................................................ 233 Volume Analysis .................................................... 233 Chart 92: United States Activated Carbon Market Analysis (2012-2022) by Application – Gas Phase and Liquid Phase in '000 Metric Tons ....................................................... 233 Chart 93: Glance at 2012, 2017 and 2022 United States Activated Carbon Volume Market Share (%) by Application – Gas Phase and Liquid Phase ....................................... 234 Value Analysis ........................................................ 235 Chart 94: United States Activated Carbon Market Analysis (2012-2022) by Application – Gas Phase and Liquid Phase in USD Million ............................................................... 235 Chart 95: Glance at 2012, 2017 and 2022 United States Activated Carbon Value Market Share (%) by Application – Gas Phase and Liquid Phase .......................................... 236 1.6.1.3 Activated Carbon Market Overview by End- Use Sector ............................................................. 237 Volume Analysis .................................................... 237 Chart 96: United States Activated Carbon Market Analysis (2012-2022) by End-Use Sector – Air Purification, Automotive Canisters, Food & Beverages, Medical & Pharmaceutical, Water Treatment and Others in '000 Metric Tons .................................................................. 237 Chart 97: Glance at 2012, 2017 and 2022 United States 6.3.2.1 Air Purification ........................................... 159 Chart 54: Global Activated Carbon in Air Purification Market Analysis (2012-2022) by Geographic Region – North America, Europe, Asia-Pacific, South America and Rest of World in USD Million ......................................... 159 Chart 55: Glance at 2012, 2017 and 2022 Global Activated Carbon in Air Purification Value Market Share (%) by Geographic Region – North America, Europe, Asia-Pacific, South America and Rest of World ................................. 160 6.3.2.2 Automotive Canisters ................................ 161 Chart 56: Global Activated Carbon in Automotive Canisters Market Analysis (2012-2022) by Geographic Region – North America, Europe, Asia-Pacific, South America and Rest of World in USD Million ......................................... 161 Chart 57: Glance at 2012, 2017 and 2022 Global Activated Carbon in Automotive Canisters Value Market Share (%) by Geographic Region – North America, Europe, Asia- Pacific, South America and Rest of World...................... 162 6.3.2.3 Food & Beverages ...................................... 163 Chart 58: Global Activated Carbon in Food & Beverages Market Analysis (2012-2022) by Geographic Region – North America, Europe, Asia-Pacific, South America and Rest of World in USD Million ......................................... 163 Chart 59: Glance at 2012, 2017 and 2022 Global Activated Carbon in Food & Beverages Value Market Share (%) by Geographic Region – North America, Europe, Asia-Pacific, South America and Rest of World ................................. 164 6.3.2.4 Medical & Pharmaceutical ......................... 165 Chart 60: Global Activated Carbon in Medical & Pharmaceutical Market Analysis (2012-2022) by Geographic Region – North America, Europe, Asia-Pacific, South America and Rest of World in USD Million .......... 165 Chart 61: Glance at 2012, 2017 and 2022 Global Activated Carbon in Medical & Pharmaceutical Value Market Share (%) by Geographic Region – North America, Europe, Asia- Pacific, South America and Rest of World...................... 166 6.3.2.5 Water Treatment ....................................... 167 Chart 62: Global Activated Carbon in Water Treatment Market Analysis (2012-2022) by Geographic Region – North America, Europe, Asia-Pacific, South America and Rest of World in USD Million ......................................... 167 Chart 63: Glance at 2012, 2017 and 2022 Global Activated Carbon in Water Treatment Value Market Share (%) by Geographic Region – North America, Europe, Asia-Pacific, South America and Rest of World ................................. 168 6.3.2.6 Other Activated Carbon End-Use Sectors .. 169 Chart 64: Global Activated Carbon in Other Activated Carbon End-Use Sectors Market Analysis (2012-2022) by Geographic Region – North America, Europe, Asia-Pacific, South America and Rest of World in USD Million .......... 169 Chart 65: Glance at 2012, 2017 and 2022 Global Activated Carbon in Other Activated Carbon End-Use Sectors Value Market Share (%) by Geographic Region – North America, Europe, Asia-Pacific, South America and Rest of World ... 170 PART B: REGIONAL MARKET PERSPECTIVE .. 171 Chart 66: The Largest Independent Regions in Terms of Projected Growth (2016-2022) for Activated Carbon Market by Geographic Region – North America, Europe, Asia-Pacific and South America ..................................... 171 Global Activated Carbon Market Overview by Geographic Region................................................. 172 Volume Analysis ..................................................... 172 Chart 67: Global Activated Carbon Market Analysis (2012-2022) by Geographic Region – North America, Europe, Asia-Pacific, South America and Rest of World in '000 Metric Tons .............. 172 Chart 68: Glance at 2012, 2017 and 2022 Global Activated Carbon Volume Market Share (%) by Geographic Region – North America, Europe, Asia-Pacific, South America and Rest of World ................................................................ 173 Value Analysis ........................................................ 174 Chart 69: Global Activated Carbon Market Analysis (2012- 2022) by Geographic Region – North America, Europe, Asia- Pacific, South America and Rest of World in USD Million . 174 Chart 70: Glance at 2012, 2017 and 2022 Global Activated Carbon Value Market Share (%) by Geographic Region – North America, Europe, Asia-Pacific, South America and Rest of World ................................................................ 175 REGIONAL MARKET OVERVIEW ........................... 176 1. NORTH AMERICA ............................................ 176 Chart 71: North American Activated Carbon Market Overview (2012-2022) in Volume ('000 Metric Tons) and Value (USD Million) ....................................................... 176 1.1 North American Activated Carbon Market Overview by Geographic Region ............................ 177 Volume Analysis..................................................... 177 Chart 72: North American Activated Carbon Market Analysis (2012-2022) by Region – United States, Canada and Mexico in '000 Metric Tons .................................... 177 Chart 73: Glance at 2012, 2017 and 2022 North American Activated Carbon Volume Market Share (%) by Region – United States, Canada and Mexico ............................... 178 Value Analysis ........................................................ 179 Chart 74: North American Activated Carbon Market Analysis (2012-2022) by Region – United States, Canada and Mexico in USD Million ............................................ 179 Chart 75: Glance at 2012, 2017 and 2022 North American Activated Carbon Value Market Share (%) by Region – United States, Canada and Mexico ............................... 180 1.2 North American Activated Carbon Market Overview by Product Segment .............................. 181 Volume Analysis..................................................... 181 Chart 76: North American Activated Carbon Market Analysis (2012-2022) by Product Segment – Granular Activated Carbon (GAC), Powdered Activated Carbon (PAC) and Other Activated Carbons in '000 Metric Tons.............................. 181 Chart 77: Glance at 2012, 2017 and 2022 North American Activated Carbon Volume Market Share (%) by Product Segment – Granular Activated Carbon (GAC), Powdered Activated Carbon (PAC) and Other Activated Carbons .. 182 Value Analysis ........................................................ 183 Chart 78: North American Activated Carbon Market Analysis (2012-2022) by Product Segment – Granular Activated Carbon (GAC), Powdered Activated Carbon (PAC) and Other Activated Carbons in USD Million ....... 183 Chart 79: Glance at 2012, 2017 and 2022 North American Activated Carbon Value Market Share (%) by Product Segment – Granular Activated Carbon (GAC), Powdered Activated Carbon (PAC) and Other Activated Carbons .. 184 1.3 North American Activated Carbon Market Overview by Application ........................................ 185 Volume Analysis..................................................... 185 Chart 80: North American Activated Carbon Market Analysis (2012-2022) by Application – Gas Phase and Liquid Phase in '000 Metric Tons ................................... 185 Chart 81: Glance at 2012, 2017 and 2022 North American Activated Carbon Volume Market Share (%) by Application – Gas Phase and Liquid Phase ....................................... 186 Value Analysis ........................................................ 187 Chart 82: North American Activated Carbon Market Analysis (2012-2022) by Application – Gas Phase and Liquid Phase in USD Million ........................................... 187 Chart 83: Glance at 2012, 2017 and 2022 North American Activated Carbon Value Market Share (%) by Application – Gas Phase and Liquid Phase .......................................... 188 1.4 North American Activated Carbon Market Overview by End-Use Sector .................................. 189 Volume Analysis..................................................... 189 Chart 84: North American Activated Carbon Market Analysis (2012-2022) by End-Use Sector – Air Purification, Automotive Canisters, Food & Beverages, Medical & Pharmaceutical, Water Treatment and Others in '000 Metric Tons ................................................................... 189 Chart 85: Glance at 2012, 2017 and 2022 North American Activated Carbon Volume Market Share (%) by End-Use Sector – Air Purification, Automotive Canisters, Food & Beverages, Medical & Pharmaceutical, Water Treatment and Others .................................................................... 190 Value Analysis ........................................................ 191 Chart 86: North American Activated Carbon Market Analysis (2012-2022) by End-Use Sector – Air Purification, Automotive Canisters, Food & Beverages, Medical & Pharmaceutical, Water Treatment and Others in USD Million ........................................................................... 191 Click here to buy the report Page 5
Activated Carbon – A Global Market Overview Jan 2016 |585 Pages | 367 Charts | Price $4320 Activated Carbon Volume Market Share (%) by End-Use Sector – Air Purification, Automotive Canisters, Food & Beverages, Medical & Pharmaceutical, Water Treatment and Others .................................................................... 238 Value Analysis ........................................................ 239 Chart 98: United States Activated Carbon Market Analysis (2012-2022) by End-Use Sector – Air Purification, Automotive Canisters, Food & Beverages, Medical & Pharmaceutical, Water Treatment and Others in USD Million ........................................................................... 239 Chart 99: Glance at 2012, 2017 and 2022 United States Activated Carbon Value Market Share (%) by End-Use Sector – Air Purification, Automotive Canisters, Food & Beverages, Medical & Pharmaceutical, Water Treatment and Others .................................................................... 240 1.6.2 Canada....................................................... 241 1.6.2.1 Activated Carbon Market Overview by Product Segment ................................................................. 241 Volume Analysis ..................................................... 241 Chart 100: Canadian Activated Carbon Market Analysis (2012-2022) by Product Segment – Granular Activated Carbon (GAC), Powdered Activated Carbon (PAC) and Other Activated Carbons in '000 Metric Tons ................ 241 Chart 101: Glance at 2012, 2017 and 2022 Canadian Activated Carbon Volume Market Share (%) by Product Segment – Granular Activated Carbon (GAC), Powdered Activated Carbon (PAC) and Other Activated Carbons ... 242 Value Analysis ........................................................ 243 Chart 102: Canadian Activated Carbon Market Analysis (2012-2022) by Product Segment – Granular Activated Carbon (GAC), Powdered Activated Carbon (PAC) and Other Activated Carbons in USD Million ........................ 243 Chart 103: Glance at 2012, 2017 and 2022 Canadian Activated Carbon Value Market Share (%) by Product Segment – Granular Activated Carbon (GAC), Powdered Activated Carbon (PAC) and Other Activated Carbons ... 244 1.6.2.2 Activated Carbon Market Overview by Application ............................................................. 245 Volume Analysis ..................................................... 245 Chart 104: Canadian Activated Carbon Market Analysis (2012-2022) by Application – Gas Phase and Liquid Phase in '000 Metric Tons ........................................................ 245 Chart 105: Glance at 2012, 2017 and 2022 Canadian Activated Carbon Volume Market Share (%) by Application – Gas Phase and Liquid Phase ........................................ 246 Value Analysis ........................................................ 247 Chart 106: Canadian Activated Carbon Market Analysis (2012-2022) by Application – Gas Phase and Liquid Phase in USD Million ................................................................ 247 Chart 107: Glance at 2012, 2017 and 2022 Canadian Activated Carbon Value Market Share (%) by Application – Gas Phase and Liquid Phase .......................................... 248 1.6.2.3 Activated Carbon Market Overview by End- Use Sector .............................................................. 249 Volume Analysis ..................................................... 249 Chart 108: Canadian Activated Carbon Market Analysis (2012-2022) by End-Use Sector – Air Purification, Automotive Canisters, Food & Beverages, Medical & Pharmaceutical, Water Treatment and Others in '000 Metric Tons ................................................................... 249 Chart 109: Glance at 2012, 2017 and 2022 Canadian Activated Carbon Volume Market Share (%) by End-Use Sector – Air Purification, Automotive Canisters, Food & Beverages, Medical & Pharmaceutical, Water Treatment and Others .................................................................... 250 Value Analysis ........................................................ 251 Chart 110: Canadian Activated Carbon Market Analysis (2012-2022) by End-Use Sector – Air Purification, Automotive Canisters, Food & Beverages, Medical & Pharmaceutical, Water Treatment and Others in USD Million ........................................................................... 251 Chart 111: Glance at 2012, 2017 and 2022 Canadian Activated Carbon Value Market Share (%) by End-Use Sector – Air Purification, Automotive Canisters, Food & Beverages, Medical & Pharmaceutical, Water Treatment and Others .................................................................... 252 1.6.3 Mexico ....................................................... 253 1.6.3.1 Activated Carbon Market Overview by Product Segment................................................................. 253 Volume Analysis..................................................... 253 Chart 112: Mexican Activated Carbon Market Analysis (2012-2022) by Product Segment – Granular Activated Carbon (GAC), Powdered Activated Carbon (PAC) and Other Activated Carbons in '000 Metric Tons ............... 253 Chart 113: Glance at 2012, 2017 and 2022 Mexican Activated Carbon Volume Market Share (%) by Product Segment – Granular Activated Carbon (GAC), Powdered Activated Carbon (PAC) and Other Activated Carbons .. 254 Value Analysis ........................................................ 255 Chart 114: Mexican Activated Carbon Market Analysis (2012-2022) by Product Segment – Granular Activated Carbon (GAC), Powdered Activated Carbon (PAC) and Other Activated Carbons in USD Million ....................... 255 Chart 115: Glance at 2012, 2017 and 2022 Mexican Activated Carbon Value Market Share (%) by Product Segment – Granular Activated Carbon (GAC), Powdered Activated Carbon (PAC) and Other Activated Carbons .. 256 1.6.3.2 Activated Carbon Market Overview by Application............................................................. 257 Volume Analysis..................................................... 257 Chart 116: Mexican Activated Carbon Market Analysis (2012-2022) by Application – Gas Phase and Liquid Phase in '000 Metric Tons ....................................................... 257 Chart 117: Glance at 2012, 2017 and 2022 Mexican Activated Carbon Volume Market Share (%) by Application – Gas Phase and Liquid Phase ....................................... 258 Value Analysis ........................................................ 259 Chart 118: Mexican Activated Carbon Market Analysis (2012-2022) by Application – Gas Phase and Liquid Phase in USD Million ............................................................... 259 Chart 119: Glance at 2012, 2017 and 2022 Mexican Activated Carbon Value Market Share (%) by Application – Gas Phase and Liquid Phase .......................................... 260 1.6.3.3 Activated Carbon Market Overview by End- Use Sector.............................................................. 261 Volume Analysis..................................................... 261 Chart 120: Mexican Activated Carbon Market Analysis (2012-2022) by End-Use Sector – Air Purification, Automotive Canisters, Food & Beverages, Medical & Pharmaceutical, Water Treatment and Others in '000 Metric Tons ................................................................... 261 Chart 121: Glance at 2012, 2017 and 2022 Mexican Activated Carbon Volume Market Share (%) by End-Use Sector – Air Purification, Automotive Canisters, Food & Beverages, Medical & Pharmaceutical, Water Treatment and Others .................................................................... 262 Value Analysis ........................................................ 263 Chart 122: Mexican Activated Carbon Market Analysis (2012-2022) by End-Use Sector – Air Purification, Automotive Canisters, Food & Beverages, Medical & Pharmaceutical, Water Treatment and Others in USD Million ........................................................................... 263 Chart 123: Glance at 2012, 2017 and 2022 Mexican Activated Carbon Value Market Share (%) by End-Use Sector – Air Purification, Automotive Canisters, Food & Beverages, Medical & Pharmaceutical, Water Treatment and Others .................................................................... 264 Value Analysis ........................................................ 268 Chart 127: European Activated Carbon Market Analysis (2012- 2022) by Region – France, Germany, Italy, Russia, Spain, United Kingdom and Rest of Europe in USD Million ......................... 268 Chart 128: Glance at 2012, 2017 and 2022 European Activated Carbon Value Market Share (%) by Region – France, Germany, Italy, Russia, Spain, United Kingdom and Rest of Europe .............................................................. 269 2.2 European Activated Carbon Market Overview by Product Segment ................................................... 270 Volume Analysis .................................................... 270 Chart 129: European Activated Carbon Market Analysis (2012-2022) by Product Segment – Granular Activated Carbon (GAC), Powdered Activated Carbon (PAC) and Other Activated Carbons in '000 Metric Tons ............... 270 Chart 130: Glance at 2012, 2017 and 2022 European Activated Carbon Volume Market Share (%) by Product Segment – Granular Activated Carbon (GAC), Powdered Activated Carbon (PAC) and Other Activated Carbons .. 271 Value Analysis ........................................................ 272 Chart 131: European Activated Carbon Market Analysis (2012-2022) by Product Segment – Granular Activated Carbon (GAC), Powdered Activated Carbon (PAC) and Other Activated Carbons in USD Million ....................... 272 Chart 132: Glance at 2012, 2017 and 2022 European Activated Carbon Value Market Share (%) by Product Segment – Granular Activated Carbon (GAC), Powdered Activated Carbon (PAC) and Other Activated Carbons .. 273 2.3 European Activated Carbon Market Overview by Application ............................................................ 274 Volume Analysis .................................................... 274 Chart 133: European Activated Carbon Market Analysis (2012-2022) by Application – Gas Phase and Liquid Phase in '000 Metric Tons ....................................................... 274 Chart 134: Glance at 2012, 2017 and 2022 European Activated Carbon Volume Market Share (%) by Application – Gas Phase and Liquid Phase ....................................... 275 Value Analysis ........................................................ 276 Chart 135: European Activated Carbon Market Analysis (2012-2022) by Application – Gas Phase and Liquid Phase in USD Million ............................................................... 276 Chart 136: Glance at 2012, 2017 and 2022 European Activated Carbon Value Market Share (%) by Application – Gas Phase and Liquid Phase .......................................... 277 2.4 European Activated Carbon Market Overview by End-Use Sector ...................................................... 278 Volume Analysis .................................................... 278 Chart 137: European Activated Carbon Market Analysis (2012-2022) by End-Use Sector – Air Purification, Automotive Canisters, Food & Beverages, Medical & Pharmaceutical, Water Treatment and Others in '000 Metric Tons .................................................................. 278 Chart 138: Glance at 2012, 2017 and 2022 European Activated Carbon Volume Market Share (%) by End-Use Sector – Air Purification, Automotive Canisters, Food & Beverages, Medical & Pharmaceutical, Water Treatment and Others .................................................................... 279 Value Analysis ........................................................ 280 Chart 139: European Activated Carbon Market Analysis (2012-2022) by End-Use Sector – Air Purification, Automotive Canisters, Food & Beverages, Medical & Pharmaceutical, Water Treatment and Others in USD Million .......................................................................... 280 Chart 140: Glance at 2012, 2017 and 2022 European Activated Carbon Value Market Share (%) by End-Use Sector – Air Purification, Automotive Canisters, Food & Beverages, Medical & Pharmaceutical, Water Treatment and Others .................................................................... 281 2.5 Major Market Players ...................................... 282 Arkema S.A. (France) .................................................... 282 CECA (France) .......................................................... 283 Cpl Carbon Link Limited (United Kingdom) ................... 285 Desotec N.V.-S.A. (Belgium) .......................................... 286 Donau Chemie Ag (Austria) .......................................... 288 International Chemical Investors Se (Luxembourg) ...... 289 CarboTech AC GmbH (Germany) .............................. 290 Silcarbon Aktivkohle GmbH (Germany) ........................ 291 2. EUROPE .......................................................... 265 Chart 124: European Activated Carbon Market Overview (2012-2022) in Volume ('000 Metric Tons) and Value (USD Million) ......................................................................... 265 2.1 European Activated Carbon Market Overview by Geographic Region ................................................ 266 Volume Analysis..................................................... 266 Chart 125: European Activated Carbon Market Analysis (2012-2022) by Region – France, Germany, Italy, Russia, Spain, United Kingdom and Rest of Europe in '000 Metric Tons .............................................................................. 266 Chart 126: Glance at 2012, 2017 and 2022 European Activated Carbon Volume Market Share (%) by Region – France, Germany, Italy, Russia, Spain, United Kingdom and Rest of Europe .............................................................. 267 Click here to buy the report Page 6
Activated Carbon – A Global Market Overview Jan 2016 |585 Pages | 367 Charts | Price $4320 2.6 European Activated Carbon Market Overview by Country .................................................................. 292 2.6.1 France ........................................................ 292 2.6.1.1 Activated Carbon Market Overview by Product Segment ................................................................. 292 Volume Analysis ..................................................... 292 Chart 141: French Activated Carbon Market Analysis (2012-2022) by Product Segment – Granular Activated Carbon (GAC), Powdered Activated Carbon (PAC) and Other Activated Carbons in '000 Metric Tons ................ 292 Chart 142: Glance at 2012, 2017 and 2022 French Activated Carbon Volume Market Share (%) by Product Segment – Granular Activated Carbon (GAC), Powdered Activated Carbon (PAC) and Other Activated Carbons ... 293 Value Analysis ........................................................ 294 Chart 143: French Activated Carbon Market Analysis (2012-2022) by Product Segment – Granular Activated Carbon (GAC), Powdered Activated Carbon (PAC) and Other Activated Carbons in USD Million ........................ 294 Chart 144: Glance at 2012, 2017 and 2022 French Activated Carbon Value Market Share (%) by Product Segment – Granular Activated Carbon (GAC), Powdered Activated Carbon (PAC) and Other Activated Carbons ... 295 2.6.1.2 Activated Carbon Market Overview by Application ............................................................. 296 Volume Analysis ..................................................... 296 Chart 145: French Activated Carbon Market Analysis (2012-2022) by Application – Gas Phase and Liquid Phase in '000 Metric Tons ........................................................ 296 Chart 146: Glance at 2012, 2017 and 2022 French Activated Carbon Volume Market Share (%) by Application – Gas Phase and Liquid Phase ........................................ 297 Value Analysis ........................................................ 298 Chart 147: French Activated Carbon Market Analysis (2012-2022) by Application – Gas Phase and Liquid Phase in USD Million ................................................................ 298 Chart 148: Glance at 2012, 2017 and 2022 French Activated Carbon Value Market Share (%) by Application – Gas Phase and Liquid Phase .......................................... 299 2.6.1.3 Activated Carbon Market Overview by End- Use Sector .............................................................. 300 Volume Analysis ..................................................... 300 Chart 149: French Activated Carbon Market Analysis (2012-2022) by End-Use Sector – Air Purification, Automotive Canisters, Food & Beverages, Medical & Pharmaceutical, Water Treatment and Others in '000 Metric Tons ................................................................... 300 Chart 150: Glance at 2012, 2017 and 2022 French Activated Carbon Volume Market Share (%) by End-Use Sector – Air Purification, Automotive Canisters, Food & Beverages, Medical & Pharmaceutical, Water Treatment and Others .................................................................... 301 Value Analysis ........................................................ 302 Chart 151: French Activated Carbon Market Analysis (2012-2022) by End-Use Sector – Air Purification, Automotive Canisters, Food & Beverages, Medical & Pharmaceutical, Water Treatment and Others in USD Million ........................................................................... 302 Chart 152: Glance at 2012, 2017 and 2022 French Activated Carbon Value Market Share (%) by End-Use Sector – Air Purification, Automotive Canisters, Food & Beverages, Medical & Pharmaceutical, Water Treatment and Others .................................................................... 303 2.6.2 Germany .................................................... 304 2.6.2.1 Activated Carbon Market Overview by Product Segment ................................................................. 304 Volume Analysis ..................................................... 304 Chart 153: German Activated Carbon Market Analysis (2012-2022) by Product Segment – Granular Activated Carbon (GAC), Powdered Activated Carbon (PAC) and Other Activated Carbons in '000 Metric Tons ................ 304 Chart 154: Glance at 2012, 2017 and 2022 German Activated Carbon Volume Market Share (%) by Product Segment – Granular Activated Carbon (GAC), Powdered Activated Carbon (PAC) and Other Activated Carbons ... 305 Value Analysis ........................................................ 306 Chart 155: German Activated Carbon Market Analysis (2012-2022) by Product Segment – Granular Activated Carbon (GAC), Powdered Activated Carbon (PAC) and Other Activated Carbons in USD Million ....................... 306 Chart 156: Glance at 2012, 2017 and 2022 German Activated Carbon Value Market Share (%) by Product Segment – Granular Activated Carbon (GAC), Powdered Activated Carbon (PAC) and Other Activated Carbons .. 307 2.6.2.2 Activated Carbon Market Overview by Application............................................................. 308 Volume Analysis..................................................... 308 Chart 157: German Activated Carbon Market Analysis (2012-2022) by Application – Gas Phase and Liquid Phase in '000 Metric Tons ....................................................... 308 Chart 158: Glance at 2012, 2017 and 2022 German Activated Carbon Volume Market Share (%) by Application – Gas Phase and Liquid Phase ....................................... 309 Value Analysis ........................................................ 310 Chart 159: German Activated Carbon Market Analysis (2012-2022) by Application – Gas Phase and Liquid Phase in USD Million ............................................................... 310 Chart 160: Glance at 2012, 2017 and 2022 German Activated Carbon Value Market Share (%) by Application – Gas Phase and Liquid Phase .......................................... 311 2.6.2.3 Activated Carbon Market Overview by End- Use Sector.............................................................. 312 Volume Analysis..................................................... 312 Chart 161: German Activated Carbon Market Analysis (2012-2022) by End-Use Sector – Air Purification, Automotive Canisters, Food & Beverages, Medical & Pharmaceutical, Water Treatment and Others in '000 Metric Tons ................................................................... 312 Chart 162: Glance at 2012, 2017 and 2022 German Activated Carbon Volume Market Share (%) by End-Use Sector – Air Purification, Automotive Canisters, Food & Beverages, Medical & Pharmaceutical, Water Treatment and Others .................................................................... 313 Value Analysis ........................................................ 314 Chart 163: German Activated Carbon Market Analysis (2012-2022) by End-Use Sector – Air Purification, Automotive Canisters, Food & Beverages, Medical & Pharmaceutical, Water Treatment and Others in USD Million ........................................................................... 314 Chart 164: Glance at 2012, 2017 and 2022 German Activated Carbon Value Market Share (%) by End-Use Sector – Air Purification, Automotive Canisters, Food & Beverages, Medical & Pharmaceutical, Water Treatment and Others .................................................................... 315 Chart 170: Glance at 2012, 2017 and 2022 Italian Activated Carbon Volume Market Share (%) by Application – Gas Phase and Liquid Phase ....................................... 321 Value Analysis ........................................................ 322 Chart 171: Italian Activated Carbon Market Analysis (2012- 2022) by Application – Gas Phase and Liquid Phase in USD Million .......................................................................... 322 Chart 172: Glance at 2012, 2017 and 2022 Italian Activated Carbon Value Market Share (%) by Application – Gas Phase and Liquid Phase .......................................... 323 2.6.3.3 Activated Carbon Market Overview by End- Use Sector ............................................................. 324 Volume Analysis .................................................... 324 Chart 173: Italian Activated Carbon Market Analysis (2012- 2022) by End-Use Sector – Air Purification, Automotive Canisters, Food & Beverages, Medical & Pharmaceutical, Water Treatment and Others in '000 Metric Tons ........ 324 Chart 174: Glance at 2012, 2017 and 2022 Italian Activated Carbon Volume Market Share (%) by End-Use Sector – Air Purification, Automotive Canisters, Food & Beverages, Medical & Pharmaceutical, Water Treatment and Others .................................................................... 325 Value Analysis ........................................................ 326 Chart 175: Italian Activated Carbon Market Analysis (2012- 2022) by End-Use Sector – Air Purification, Automotive Canisters, Food & Beverages, Medical & Pharmaceutical, Water Treatment and Others in USD Million ................ 326 Chart 176: Glance at 2012, 2017 and 2022 Italian Activated Carbon Value Market Share (%) by End-Use Sector – Air Purification, Automotive Canisters, Food & Beverages, Medical & Pharmaceutical, Water Treatment and Others .................................................................... 327 2.6.4 Russia ........................................................ 328 2.6.4.1 Activated Carbon Market Overview by Product Segment ................................................................ 328 Volume Analysis .................................................... 328 Chart 177: Russian Activated Carbon Market Analysis (2012-2022) by Product Segment – Granular Activated Carbon (GAC), Powdered Activated Carbon (PAC) and Other Activated Carbons in '000 Metric Tons ............... 328 Chart 178: Glance at 2012, 2017 and 2022 Russian Activated Carbon Volume Market Share (%) by Product Segment – Granular Activated Carbon (GAC), Powdered Activated Carbon (PAC) and Other Activated Carbons .. 329 Value Analysis ........................................................ 330 Chart 179: Russian Activated Carbon Market Analysis (2012-2022) by Product Segment – Granular Activated Carbon (GAC), Powdered Activated Carbon (PAC) and Other Activated Carbons in USD Million ....................... 330 Chart 180: Glance at 2012, 2017 and 2022 Russian Activated Carbon Value Market Share (%) by Product Segment – Granular Activated Carbon (GAC), Powdered Activated Carbon (PAC) and Other Activated Carbons .. 331 2.6.4.2 Activated Carbon Market Overview by Application ............................................................ 332 Volume Analysis .................................................... 332 Chart 181: Russian Activated Carbon Market Analysis (2012-2022) by Application – Gas Phase and Liquid Phase in '000 Metric Tons ....................................................... 332 Chart 182: Glance at 2012, 2017 and 2022 Russian Activated Carbon Volume Market Share (%) by Application – Gas Phase and Liquid Phase ....................................... 333 Value Analysis ........................................................ 334 Chart 183: Russian Activated Carbon Market Analysis (2012-2022) by Application – Gas Phase and Liquid Phase in USD Million ............................................................... 334 Chart 184: Glance at 2012, 2017 and 2022 Russian Activated Carbon Value Market Share (%) by Application – Gas Phase and Liquid Phase .......................................... 335 2.6.4.3 Activated Carbon Market Overview by End- Use Sector ............................................................. 336 Volume Analysis .................................................... 336 Chart 185: Russian Activated Carbon Market Analysis (2012- 2022) by End-Use Sector – Air Purification, Automotive Canisters, Food & Beverages, Medical & Pharmaceutical, Water Treatment and Others in '000 Metric Tons ............ 336 2.6.3 Italy ........................................................... 316 2.6.3.1 Activated Carbon Market Overview by Product Segment................................................................. 316 Volume Analysis..................................................... 316 Chart 165: Italian Activated Carbon Market Analysis (2012- 2022) by Product Segment – Granular Activated Carbon (GAC), Powdered Activated Carbon (PAC) and Other Activated Carbons in '000 Metric Tons .......................... 316 Chart 166: Glance at 2012, 2017 and 2022 Italian Activated Carbon Volume Market Share (%) by Product Segment – Granular Activated Carbon (GAC), Powdered Activated Carbon (PAC) and Other Activated Carbons .. 317 Value Analysis ........................................................ 318 Chart 167: Italian Activated Carbon Market Analysis (2012- 2022) by Product Segment – Granular Activated Carbon (GAC), Powdered Activated Carbon (PAC) and Other Activated Carbons in USD Million .................................. 318 Chart 168: Glance at 2012, 2017 and 2022 Italian Activated Carbon Value Market Share (%) by Product Segment – Granular Activated Carbon (GAC), Powdered Activated Carbon (PAC) and Other Activated Carbons .. 319 2.6.3.2 Activated Carbon Market Overview by Application............................................................. 320 Volume Analysis..................................................... 320 Chart 169: Italian Activated Carbon Market Analysis (2012- 2022) by Application – Gas Phase and Liquid Phase in '000 Metric Tons ................................................................... 320 Click here to buy the report Page 7
Activated Carbon – A Global Market Overview Jan 2016 |585 Pages | 367 Charts | Price $4320 Chart 186: Glance at 2012, 2017 and 2022 Russian Activated Carbon Volume Market Share (%) by End-Use Sector – Air Purification, Automotive Canisters, Food & Beverages, Medical & Pharmaceutical, Water Treatment and Others .................................................................... 337 Value Analysis ........................................................ 338 Chart 187: Russian Activated Carbon Market Analysis (2012-2022) by End-Use Sector – Air Purification, Automotive Canisters, Food & Beverages, Medical & Pharmaceutical, Water Treatment and Others in USD Million ........................................................................... 338 Chart 188: Glance at 2012, 2017 and 2022 Russian Activated Carbon Value Market Share (%) by End-Use Sector – Air Purification, Automotive Canisters, Food & Beverages, Medical & Pharmaceutical, Water Treatment and Others .................................................................... 339 2.6.5 Spain ......................................................... 340 2.6.5.1 Activated Carbon Market Overview by Product Segment ................................................................. 340 Volume Analysis ..................................................... 340 Chart 189: Spanish Activated Carbon Market Analysis (2012-2022) by Product Segment – Granular Activated Carbon (GAC), Powdered Activated Carbon (PAC) and Other Activated Carbons in '000 Metric Tons ................ 340 Chart 190: Glance at 2012, 2017 and 2022 Spanish Activated Carbon Volume Market Share (%) by Product Segment – Granular Activated Carbon (GAC), Powdered Activated Carbon (PAC) and Other Activated Carbons ... 341 Value Analysis ........................................................ 342 Chart 191: Spanish Activated Carbon Market Analysis (2012-2022) by Product Segment – Granular Activated Carbon (GAC), Powdered Activated Carbon (PAC) and Other Activated Carbons in USD Million ........................ 342 Chart 192: Glance at 2012, 2017 and 2022 Spanish Activated Carbon Value Market Share (%) by Product Segment – Granular Activated Carbon (GAC), Powdered Activated Carbon (PAC) and Other Activated Carbons ... 343 2.6.5.2 Activated Carbon Market Overview by Application ............................................................. 344 Volume Analysis ..................................................... 344 Chart 193: Spanish Activated Carbon Market Analysis (2012-2022) by Application – Gas Phase and Liquid Phase in '000 Metric Tons ........................................................ 344 Chart 194: Glance at 2012, 2017 and 2022 Spanish Activated Carbon Volume Market Share (%) by Application – Gas Phase and Liquid Phase ........................................ 345 Value Analysis ........................................................ 346 Chart 195: Spanish Activated Carbon Market Analysis (2012-2022) by Application – Gas Phase and Liquid Phase in USD Million ................................................................ 346 Chart 196: Glance at 2012, 2017 and 2022 Spanish Activated Carbon Value Market Share (%) by Application – Gas Phase and Liquid Phase .......................................... 347 2.6.5.3 Activated Carbon Market Overview by End- Use Sector .............................................................. 348 Volume Analysis ..................................................... 348 Chart 197: Spanish Activated Carbon Market Analysis (2012-2022) by End-Use Sector – Air Purification, Automotive Canisters, Food & Beverages, Medical & Pharmaceutical, Water Treatment and Others in '000 Metric Tons ................................................................... 348 Chart 198: Glance at 2012, 2017 and 2022 Spanish Activated Carbon Volume Market Share (%) by End-Use Sector – Air Purification, Automotive Canisters, Food & Beverages, Medical & Pharmaceutical, Water Treatment and Others .................................................................... 349 Value Analysis ........................................................ 350 Chart 199: Spanish Activated Carbon Market Analysis (2012-2022) by End-Use Sector – Air Purification, Automotive Canisters, Food & Beverages, Medical & Pharmaceutical, Water Treatment and Others in USD Million ........................................................................... 350 Chart 200: Glance at 2012, 2017 and 2022 Spanish Activated Carbon Value Market Share (%) by End-Use Sector – Air Purification, Automotive Canisters, Food & Beverages, Medical & Pharmaceutical, Water Treatment and Others .................................................................... 351 2.6.6 The United Kingdom ................................... 352 2.6.6.1 Activated Carbon Market Overview by Product Segment................................................................. 352 Volume Analysis..................................................... 352 Chart 201: United Kingdom Activated Carbon Market Analysis (2012-2022) by Product Segment – Granular Activated Carbon (GAC), Powdered Activated Carbon (PAC) and Other Activated Carbons in '000 Metric Tons ............ 352 Chart 202: Glance at 2012, 2017 and 2022 United Kingdom Activated Carbon Volume Market Share (%) by Product Segment – Granular Activated Carbon (GAC), Powdered Activated Carbon (PAC) and Other Activated Carbons .. 353 Value Analysis ........................................................ 354 Chart 203: United Kingdom Activated Carbon Market Analysis (2012-2022) by Product Segment – Granular Activated Carbon (GAC), Powdered Activated Carbon (PAC) and Other Activated Carbons in USD Million ....... 354 Chart 204: Glance at 2012, 2017 and 2022 United Kingdom Activated Carbon Value Market Share (%) by Product Segment – Granular Activated Carbon (GAC), Powdered Activated Carbon (PAC) and Other Activated Carbons .. 355 2.6.6.2 Activated Carbon Market Overview by Application............................................................. 356 Volume Analysis..................................................... 356 Chart 205: United Kingdom Activated Carbon Market Analysis (2012-2022) by Application – Gas Phase and Liquid Phase in '000 Metric Tons ................................... 356 Chart 206: Glance at 2012, 2017 and 2022 United Kingdom Activated Carbon Volume Market Share (%) by Application – Gas Phase and Liquid Phase ....................................... 357 Value Analysis ........................................................ 358 Chart 207: United Kingdom Activated Carbon Market Analysis (2012-2022) by Application – Gas Phase and Liquid Phase in USD Million ........................................... 358 Chart 208: Glance at 2012, 2017 and 2022 United Kingdom Activated Carbon Value Market Share (%) by Application – Gas Phase and Liquid Phase .......................................... 359 2.6.6.3 Activated Carbon Market Overview by End- Use Sector.............................................................. 360 Volume Analysis..................................................... 360 Chart 209: United Kingdom Activated Carbon Market Analysis (2012-2022) by End-Use Sector – Air Purification, Automotive Canisters, Food & Beverages, Medical & Pharmaceutical, Water Treatment and Others in '000 Metric Tons ................................................................... 360 Chart 210: Glance at 2012, 2017 and 2022 United Kingdom Activated Carbon Volume Market Share (%) by End-Use Sector – Air Purification, Automotive Canisters, Food & Beverages, Medical & Pharmaceutical, Water Treatment and Others .................................................................... 361 Value Analysis ........................................................ 362 Chart 211: United Kingdom Activated Carbon Market Analysis (2012-2022) by End-Use Sector – Air Purification, Automotive Canisters, Food & Beverages, Medical & Pharmaceutical, Water Treatment and Others in USD Million ........................ 362 Chart 212: Glance at 2012, 2017 and 2022 United Kingdom Activated Carbon Value Market Share (%) by End-Use Sector – Air Purification, Automotive Canisters, Food & Beverages, Medical & Pharmaceutical, Water Treatment and Others ... 363 2.6.7 Rest of Europe ............................................ 364 2.6.7.1 Activated Carbon Market Overview by Product Segment................................................................. 364 Volume Analysis..................................................... 364 Chart 213: Rest of Europe Activated Carbon Market Analysis (2012-2022) by Product Segment – Granular Activated Carbon (GAC), Powdered Activated Carbon (PAC) and Other Activated Carbons in '000 Metric Tons.............................. 364 Chart 214: Glance at 2012, 2017 and 2022 Rest of Europe Activated Carbon Volume Market Share (%) by Product Segment – Granular Activated Carbon (GAC), Powdered Activated Carbon (PAC) and Other Activated Carbons .. 365 Value Analysis ........................................................ 366 Chart 215: Rest of Europe Activated Carbon Market Analysis (2012-2022) by Product Segment – Granular Activated Carbon (GAC), Powdered Activated Carbon (PAC) and Other Activated Carbons in USD Million ....... 366 Chart 216: Glance at 2012, 2017 and 2022 Rest of Europe Activated Carbon Value Market Share (%) by Product Segment – Granular Activated Carbon (GAC), Powdered Activated Carbon (PAC) and Other Activated Carbons .. 367 2.6.7.2 Activated Carbon Market Overview by Application ............................................................ 368 Volume Analysis .................................................... 368 Chart 217: Rest of Europe Activated Carbon Market Analysis (2012-2022) by Application – Gas Phase and Liquid Phase in '000 Metric Tons .................................. 368 Chart 218: Glance at 2012, 2017 and 2022 Rest of Europe Activated Carbon Volume Market Share (%) by Application – Gas Phase and Liquid Phase ....................................... 369 Value Analysis ........................................................ 370 Chart 219: Rest of Europe Activated Carbon Market Analysis (2012-2022) by Application – Gas Phase and Liquid Phase in USD Million .......................................... 370 Chart 220: Glance at 2012, 2017 and 2022 Rest of Europe Activated Carbon Value Market Share (%) by Application – Gas Phase and Liquid Phase .......................................... 371 2.6.7.3 Activated Carbon Market Overview by End- Use Sector ............................................................. 372 Volume Analysis .................................................... 372 Chart 221: Rest of Europe Activated Carbon Market Analysis (2012-2022) by End-Use Sector – Air Purification, Automotive Canisters, Food & Beverages, Medical & Pharmaceutical, Water Treatment and Others in '000 Metric Tons .................................................................. 372 Chart 222: Glance at 2012, 2017 and 2022 Rest of Europe Activated Carbon Volume Market Share (%) by End-Use Sector – Air Purification, Automotive Canisters, Food & Beverages, Medical & Pharmaceutical, Water Treatment and Others .................................................................... 373 Value Analysis ........................................................ 374 Chart 223: Rest of Europe Activated Carbon Market Analysis (2012-2022) by End-Use Sector – Air Purification, Automotive Canisters, Food & Beverages, Medical & Pharmaceutical, Water Treatment and Others in USD Million .......................................................................... 374 Chart 224: Glance at 2012, 2017 and 2022 Rest of Europe Activated Carbon Value Market Share (%) by End-Use Sector – Air Purification, Automotive Canisters, Food & Beverages, Medical & Pharmaceutical, Water Treatment and Others .................................................................... 375 3. ASIA-PACIFIC ................................................... 376 Chart 225: Asia-Pacific Activated Carbon Market Overview (2012-2022) in Volume ('000 Metric Tons) and Value (USD Million) ......................................................................... 376 3.1 Asia-Pacific Activated Carbon Market Overview by Geographic Region ................................................ 377 Volume Analysis .................................................... 377 Chart 226: Asia-Pacific Activated Carbon Market Analysis (2012-2022) by Region – China, India, Japan, South Korea and Rest of Asia-Pacific in '000 Metric Tons ................. 377 Chart 227: Glance at 2012, 2017 and 2022 Asia-Pacific Activated Carbon Volume Market Share (%) by Region – China, India, Japan, South Korea and Rest of Asia-Pacific . 378 Value Analysis ........................................................ 379 Chart 228: Asia-Pacific Activated Carbon Market Analysis (2012-2022) by Region – China, India, Japan, South Korea and Rest of Asia-Pacific in USD Million ......................... 379 Chart 229: Glance at 2012, 2017 and 2022 Asia-Pacific Activated Carbon Value Market Share (%) by Region – China, India, Japan, South Korea and Rest of Asia-Pacific ............ 380 3.2 Asia-Pacific Activated Carbon Market Overview by Product Segment ................................................... 381 Volume Analysis .................................................... 381 Chart 230: Asia-Pacific Activated Carbon Market Analysis (2012-2022) by Product Segment – Granular Activated Carbon (GAC), Powdered Activated Carbon (PAC) and Other Activated Carbons in '000 Metric Tons ............... 381 Chart 231: Glance at 2012, 2017 and 2022 Asia-Pacific Activated Carbon Volume Market Share (%) by Product Segment – Granular Activated Carbon (GAC), Powdered Activated Carbon (PAC) and Other Activated Carbons .. 382 Click here to buy the report Page 8
Activated Carbon – A Global Market Overview Jan 2016 |585 Pages | 367 Charts | Price $4320 Chart 253: Glance at 2012, 2017 and 2022 Chinese Activated Carbon Value Market Share (%) by End-Use Sector – Air Purification, Automotive Canisters, Food & Beverages, Medical & Pharmaceutical, Water Treatment and Others .................................................................... 455 3.6.2 India........................................................... 456 3.6.2.1 Activated Carbon Market Overview by Product Segment ................................................................ 456 Volume Analysis .................................................... 456 Chart 254: Indian Activated Carbon Market Analysis (2012- 2022) by Product Segment – Granular Activated Carbon (GAC), Powdered Activated Carbon (PAC) and Other Activated Carbons in '000 Metric Tons ......................... 456 Chart 255: Glance at 2012, 2017 and 2022 Indian Activated Carbon Volume Market Share (%) by Product Segment – Granular Activated Carbon (GAC), Powdered Activated Carbon (PAC) and Other Activated Carbons .. 457 Value Analysis ........................................................ 458 Chart 256: Indian Activated Carbon Market Analysis (2012- 2022) by Product Segment – Granular Activated Carbon (GAC), Powdered Activated Carbon (PAC) and Other Activated Carbons in USD Million ................................. 458 Chart 257: Glance at 2012, 2017 and 2022 Indian Activated Carbon Value Market Share (%) by Product Segment – Granular Activated Carbon (GAC), Powdered Activated Carbon (PAC) and Other Activated Carbons .. 459 3.6.2.2 Activated Carbon Market Overview by Application ............................................................ 460 Volume Analysis .................................................... 460 Chart 258: Indian Activated Carbon Market Analysis (2012- 2022) by Application – Gas Phase and Liquid Phase in '000 Metric Tons .................................................................. 460 Chart 259: Glance at 2012, 2017 and 2022 Indian Activated Carbon Volume Market Share (%) by Application – Gas Phase and Liquid Phase ....................................... 461 Value Analysis ........................................................ 462 Chart 260: Indian Activated Carbon Market Analysis (2012- 2022) by Application – Gas Phase and Liquid Phase in USD Million .......................................................................... 462 Chart 261: Glance at 2012, 2017 and 2022 Indian Activated Carbon Value Market Share (%) by Application – Gas Phase and Liquid Phase .......................................... 463 3.6.2.3 Activated Carbon Market Overview by End- Use Sector ............................................................. 464 Volume Analysis .................................................... 464 Chart 262: Indian Activated Carbon Market Analysis (2012- 2022) by End-Use Sector – Air Purification, Automotive Canisters, Food & Beverages, Medical & Pharmaceutical, Water Treatment and Others in '000 Metric Tons ........ 464 Chart 263: Glance at 2012, 2017 and 2022 Indian Activated Carbon Volume Market Share (%) by End-Use Sector – Air Purification, Automotive Canisters, Food & Beverages, Medical & Pharmaceutical, Water Treatment and Others .................................................................... 465 Value Analysis ........................................................ 466 Chart 264: Indian Activated Carbon Market Analysis (2012- 2022) by End-Use Sector – Air Purification, Automotive Canisters, Food & Beverages, Medical & Pharmaceutical, Water Treatment and Others in USD Million ................ 466 Chart 265: Glance at 2012, 2017 and 2022 Indian Activated Carbon Value Market Share (%) by End-Use Sector – Air Purification, Automotive Canisters, Food & Beverages, Medical & Pharmaceutical, Water Treatment and Others .................................................................... 467 3.6.3 Japan ......................................................... 468 3.6.3.1 Activated Carbon Market Overview by Product Segment ................................................................ 468 Volume Analysis .................................................... 468 Chart 266: Japanese Activated Carbon Market Analysis (2012-2022) by Product Segment – Granular Activated Carbon (GAC), Powdered Activated Carbon (PAC) and Other Activated Carbons in '000 Metric Tons ............... 468 Chart 267: Glance at 2012, 2017 and 2022 Japanese Activated Carbon Volume Market Share (%) by Product Segment – Granular Activated Carbon (GAC), Powdered Activated Carbon (PAC) and Other Activated Carbons .. 469 Value Analysis ........................................................ 383 Chart 232: Asia-Pacific Activated Carbon Market Analysis (2012-2022) by Product Segment – Granular Activated Carbon (GAC), Powdered Activated Carbon (PAC) and Other Activated Carbons in USD Million ........................ 383 Chart 233: Glance at 2012, 2017 and 2022 Asia-Pacific Activated Carbon Value Market Share (%) by Product Segment – Granular Activated Carbon (GAC), Powdered Activated Carbon (PAC) and Other Activated Carbons ... 384 3.3 Asia-Pacific Activated Carbon Market Overview by Application ............................................................. 385 Volume Analysis ..................................................... 385 Chart 234: Asia-Pacific Activated Carbon Market Analysis (2012-2022) by Application – Gas Phase and Liquid Phase in '000 Metric Tons ........................................................ 385 Chart 235: Glance at 2012, 2017 and 2022 Asia-Pacific Activated Carbon Volume Market Share (%) by Application – Gas Phase and Liquid Phase ........................................ 386 Value Analysis ........................................................ 387 Chart 236: Asia-Pacific Activated Carbon Market Analysis (2012-2022) by Application – Gas Phase and Liquid Phase in USD Million ................................................................ 387 Chart 237: Glance at 2012, 2017 and 2022 Asia-Pacific Activated Carbon Value Market Share (%) by Application – Gas Phase and Liquid Phase .......................................... 388 3.4 Asia-Pacific Activated Carbon Market Overview by End-Use Sector ...................................................... 389 Volume Analysis ..................................................... 389 Chart 238: Asia-Pacific Activated Carbon Market Analysis (2012-2022) by End-Use Sector – Air Purification, Automotive Canisters, Food & Beverages, Medical & Pharmaceutical, Water Treatment and Others in '000 Metric Tons ................................................................... 389 Chart 239: Glance at 2012, 2017 and 2022 Asia-Pacific Activated Carbon Volume Market Share (%) by End-Use Sector – Air Purification, Automotive Canisters, Food & Beverages, Medical & Pharmaceutical, Water Treatment and Others .................................................................... 390 Value Analysis ........................................................ 391 Chart 240: Asia-Pacific Activated Carbon Market Analysis (2012-2022) by End-Use Sector – Air Purification, Automotive Canisters, Food & Beverages, Medical & Pharmaceutical, Water Treatment and Others in USD Million ........................................................................... 391 Chart 241: Glance at 2012, 2017 and 2022 Asia-Pacific Activated Carbon Value Market Share (%) by End-Use Sector – Air Purification, Automotive Canisters, Food & Beverages, Medical & Pharmaceutical, Water Treatment and Others .................................................................... 392 3.5 Major Market Players ...................................... 393 Activated Carbon Technologies Pty Ltd (Australia) ........ 393 Active Char Products Pvt. Ltd. (India) ............................ 394 Boyce Carbon (India) ..................................................... 395 Capital Carbon (India) .................................................... 396 Carbonscape Ltd (New Zealand) .................................... 397 Datong Coal Jinding Activated Carbon Co. Ltd. (China) .. 398 Datong Fuping Activated Carbon (China) ....................... 398 Datong Locomotive Coal & Chemicals Co., Ltd. (China) . 399 Datong Municipal Yunguang Activated Carbon Co., Ltd. (China) .. 399 Fujian Xinsen Carbon Co. Ltd. (China) ............................ 400 Fujian Yuanli Active Carbon Industrial Co., Ltd. (China) . 401 Fujian Zhixing Activated Carbon Co., Ltd. (China) .......... 402 Futamura Chemical Co., Limited (Japan) ....................... 404 Golden Lake Carbon Co., Ltd (China) ............................. 405 Goldstar Carbon Tech Inc. (Taiwan) ............................... 406 Hangzhou Hengxing Activated Carbon Co., Ltd. (China). 407 Hayleys PLC (Sri Lanka) .................................................. 408 Haycarb PLC (Sri Lanka) ............................................ 409 Eurocarb (United Kingdom) ...................................... 410 Puritas Limited (Sri Lanka) ........................................ 412 Huairen Huanyu Purification Materials Co., Ltd. (China) 413 Indo German Carbons Limited (India) ............................ 414 Inner Mongolia Taixi Coal Group (China) ....................... 415 Jayeon Science Industry Co., Ltd. (South Korea) ............ 416 Jiangsu Zhuxi Activated Carbon Co., Ltd. (China) ........... 417 Kalpaka Chemicals Private Limited (India) ..................... 419 Kan-Carbon Private Limited (India) ................................ 421 Kuraray Co., Ltd. (Japan) ................................................ 422 Kuraray Chemical Co., Ltd. (Japan) ........................... 423 Kureha Corporation (Japan) .......................................... 424 Ningxia Guanghua-Cherishmet Activated Carbon Co., Ltd. (China) .. 425 Ningxia Huahui Activated Carbon Company Limited (China) ... 426 Osaka Gas Chemicals Co., Ltd. (Japan) .......................... 427 Century Chemical Works Sdn. Bhd. (Malaysia) ......... 429 Jacobi Carbons Ab (Sweden) .................................... 430 Minabe Chemical Industries, Ltd. (Japan) ................. 431 Davao Central Chemical Corporation (Philippines) ... 432 Hakata Chemical Co., Ltd. (Japan) ............................ 432 Pacific Activated Carbon Company (Philippines) ........... 433 Philippine-Japan Active Carbon Corporation (Philippines) ... 434 Pt. Intan Prima Group (Indonesia) ................................. 435 Raj Carbons (India) ........................................................ 435 Shanghai Mebao Activated Carbon Co., Ltd. (China) ..... 436 Shanghai Xing Chang Activated Carbon Co., Ltd. (China)437 Shanxi Xinhua Chemical Co., Ltd. (China) ...................... 438 Shanxi Xinhua Activated Carbon Co., Ltd. (China) ..... 439 Shinkwang Chemical Industry Co., Ltd. (South Korea) ... 441 Universal Carbons (India) .............................................. 442 Universal Carbons India (India) ..................................... 443 3.6 Asia-Pacific Activated Carbon Market Overview by Country .................................................................. 444 3.6.1 China ......................................................... 444 3.6.1.1 Activated Carbon Market Overview by Product Segment................................................................. 444 Volume Analysis..................................................... 444 Chart 242: Chinese Activated Carbon Market Analysis (2012-2022) by Product Segment – Granular Activated Carbon (GAC), Powdered Activated Carbon (PAC) and Other Activated Carbons in '000 Metric Tons ............... 444 Chart 243: Glance at 2012, 2017 and 2022 Chinese Activated Carbon Volume Market Share (%) by Product Segment – Granular Activated Carbon (GAC), Powdered Activated Carbon (PAC) and Other Activated Carbons .. 445 Value Analysis ........................................................ 446 Chart 244: Chinese Activated Carbon Market Analysis (2012-2022) by Product Segment – Granular Activated Carbon (GAC), Powdered Activated Carbon (PAC) and Other Activated Carbons in USD Million ....................... 446 Chart 245: Glance at 2012, 2017 and 2022 Chinese Activated Carbon Value Market Share (%) by Product Segment – Granular Activated Carbon (GAC), Powdered Activated Carbon (PAC) and Other Activated Carbons .. 447 3.6.1.2 Activated Carbon Market Overview by Application............................................................. 448 Volume Analysis..................................................... 448 Chart 246: Chinese Activated Carbon Market Analysis (2012-2022) by Application – Gas Phase and Liquid Phase in '000 Metric Tons ....................................................... 448 Chart 247: Glance at 2012, 2017 and 2022 Chinese Activated Carbon Volume Market Share (%) by Application – Gas Phase and Liquid Phase ....................................... 449 Value Analysis ........................................................ 450 Chart 248: Chinese Activated Carbon Market Analysis (2012-2022) by Application – Gas Phase and Liquid Phase in USD Million ............................................................... 450 Chart 249: Glance at 2012, 2017 and 2022 Chinese Activated Carbon Value Market Share (%) by Application – Gas Phase and Liquid Phase .......................................... 451 3.6.1.3 Activated Carbon Market Overview by End- Use Sector.............................................................. 452 Volume Analysis..................................................... 452 Chart 250: Chinese Activated Carbon Market Analysis (2012- 2022) by End-Use Sector – Air Purification, Automotive Canisters, Food & Beverages, Medical & Pharmaceutical, Water Treatment and Others in '000 Metric Tons ............ 452 Chart 251: Glance at 2012, 2017 and 2022 Chinese Activated Carbon Volume Market Share (%) by End-Use Sector – Air Purification, Automotive Canisters, Food & Beverages, Medical & Pharmaceutical, Water Treatment and Others .................................................................... 453 Value Analysis ........................................................ 454 Chart 252: Chinese Activated Carbon Market Analysis (2012- 2022) by End-Use Sector – Air Purification, Automotive Canisters, Food & Beverages, Medical & Pharmaceutical, Water Treatment and Others in USD Million .................... 454 Click here to buy the report Page 9
Activated Carbon – A Global Market Overview Jan 2016 |585 Pages | 367 Charts | Price $4320 Chart 283: Glance at 2012, 2017 and 2022 South Korean Activated Carbon Volume Market Share (%) by Application – Gas Phase and Liquid Phase ....................................... 485 Value Analysis ........................................................ 486 Chart 284: South Korean Activated Carbon Market Analysis (2012-2022) by Application – Gas Phase and Liquid Phase in USD Million ........................................... 486 Chart 285: Glance at 2012, 2017 and 2022 South Korean Activated Carbon Value Market Share (%) by Application – Gas Phase and Liquid Phase .......................................... 487 3.6.4.3 Activated Carbon Market Overview by End- Use Sector.............................................................. 488 Volume Analysis..................................................... 488 Chart 286: South Korean Activated Carbon Market Analysis (2012-2022) by End-Use Sector – Air Purification, Automotive Canisters, Food & Beverages, Medical & Pharmaceutical, Water Treatment and Others in '000 Metric Tons ................................................................... 488 Chart 287: Glance at 2012, 2017 and 2022 South Korean Activated Carbon Volume Market Share (%) by End-Use Sector – Air Purification, Automotive Canisters, Food & Beverages, Medical & Pharmaceutical, Water Treatment and Others .................................................................... 489 Value Analysis ........................................................ 490 Chart 288: South Korean Activated Carbon Market Analysis (2012-2022) by End-Use Sector – Air Purification, Automotive Canisters, Food & Beverages, Medical & Pharmaceutical, Water Treatment and Others in USD Million ........................................................................... 490 Chart 289: Glance at 2012, 2017 and 2022 South Korean Activated Carbon Value Market Share (%) by End-Use Sector – Air Purification, Automotive Canisters, Food & Beverages, Medical & Pharmaceutical, Water Treatment and Others .................................................................... 491 3.6.5 Rest of Asia-Pacific ..................................... 492 3.6.5.1 Activated Carbon Market Overview by Product Segment................................................................. 492 Volume Analysis..................................................... 492 Chart 290: Rest of Asia-Pacific Activated Carbon Market Analysis (2012-2022) by Product Segment – Granular Activated Carbon (GAC), Powdered Activated Carbon (PAC) and Other Activated Carbons in '000 Metric Tons ............ 492 Chart 291: Glance at 2012, 2017 and 2022 Rest of Asia- Pacific Activated Carbon Volume Market Share (%) by Product Segment – Granular Activated Carbon (GAC), Powdered Activated Carbon (PAC) and Other Activated Carbons ......................................................................... 493 Value Analysis ........................................................ 494 Chart 292: Rest of Asia-Pacific Activated Carbon Market Analysis (2012-2022) by Product Segment – Granular Activated Carbon (GAC), Powdered Activated Carbon (PAC) and Other Activated Carbons in USD Million ....... 494 Chart 293: Glance at 2012, 2017 and 2022 Rest of Asia- Pacific Activated Carbon Value Market Share (%) by Product Segment – Granular Activated Carbon (GAC), Powdered Activated Carbon (PAC) and Other Activated Carbons ......................................................................... 495 3.6.5.2 Activated Carbon Market Overview by Application............................................................. 496 Volume Analysis..................................................... 496 Chart 294: Rest of Asia-Pacific Activated Carbon Market Analysis (2012-2022) by Application – Gas Phase and Liquid Phase in '000 Metric Tons ................................... 496 Chart 295: Glance at 2012, 2017 and 2022 Rest of Asia- Pacific Activated Carbon Volume Market Share (%) by Application – Gas Phase and Liquid Phase .................... 497 Value Analysis ........................................................ 498 Chart 296: Rest of Asia-Pacific Activated Carbon Market Analysis (2012-2022) by Application – Gas Phase and Liquid Phase in USD Million ........................................... 498 Chart 297: Glance at 2012, 2017 and 2022 Rest of Asia- Pacific Activated Carbon Value Market Share (%) by Application – Gas Phase and Liquid Phase .................... 499 3.6.5.3 Activated Carbon Market Overview by End- Use Sector.............................................................. 500 Volume Analysis..................................................... 500 Chart 298: Rest of Asia-Pacific Activated Carbon Market Analysis (2012-2022) by End-Use Sector – Air Purification, Automotive Canisters, Food & Beverages, Medical & Pharmaceutical, Water Treatment and Others in '000 Metric Tons .................................................................. 500 Chart 299: Glance at 2012, 2017 and 2022 Rest of Asia- Pacific Activated Carbon Volume Market Share (%) by End- Use Sector – Air Purification, Automotive Canisters, Food & Beverages, Medical & Pharmaceutical, Water Treatment and Others .................................................................... 501 Value Analysis ........................................................ 502 Chart 300: Rest of Asia-Pacific Activated Carbon Market Analysis (2012-2022) by End-Use Sector – Air Purification, Automotive Canisters, Food & Beverages, Medical & Pharmaceutical, Water Treatment and Others in USD Million ......................................... 502 Chart 301: Glance at 2012, 2017 and 2022 Rest of Asia- Pacific Activated Carbon Value Market Share (%) by End- Use Sector – Air Purification, Automotive Canisters, Food & Beverages, Medical & Pharmaceutical, Water Treatment and Others .................................................................... 503 Value Analysis ........................................................ 470 Chart 268: Japanese Activated Carbon Market Analysis (2012-2022) by Product Segment – Granular Activated Carbon (GAC), Powdered Activated Carbon (PAC) and Other Activated Carbons in USD Million ........................ 470 Chart 269: Glance at 2012, 2017 and 2022 Japanese Activated Carbon Value Market Share (%) by Product Segment – Granular Activated Carbon (GAC), Powdered Activated Carbon (PAC) and Other Activated Carbons ... 471 3.6.3.2 Activated Carbon Market Overview by Application ............................................................. 472 Volume Analysis ..................................................... 472 Chart 270: Japanese Activated Carbon Market Analysis (2012-2022) by Application – Gas Phase and Liquid Phase in '000 Metric Tons ........................................................ 472 Chart 271: Glance at 2012, 2017 and 2022 Japanese Activated Carbon Volume Market Share (%) by Application – Gas Phase and Liquid Phase ........................................ 473 Value Analysis ........................................................ 474 Chart 272: Japanese Activated Carbon Market Analysis (2012-2022) by Application – Gas Phase and Liquid Phase in USD Million ................................................................ 474 Chart 273: Glance at 2012, 2017 and 2022 Japanese Activated Carbon Value Market Share (%) by Application – Gas Phase and Liquid Phase .......................................... 475 3.6.3.3 Activated Carbon Market Overview by End- Use Sector .............................................................. 476 Volume Analysis ..................................................... 476 Chart 274: Japanese Activated Carbon Market Analysis (2012-2022) by End-Use Sector – Air Purification, Automotive Canisters, Food & Beverages, Medical & Pharmaceutical, Water Treatment and Others in '000 Metric Tons ................................................................... 476 Chart 275: Glance at 2012, 2017 and 2022 Japanese Activated Carbon Volume Market Share (%) by End-Use Sector – Air Purification, Automotive Canisters, Food & Beverages, Medical & Pharmaceutical, Water Treatment and Others .................................................................... 477 Value Analysis ........................................................ 478 Chart 276: Japanese Activated Carbon Market Analysis (2012-2022) by End-Use Sector – Air Purification, Automotive Canisters, Food & Beverages, Medical & Pharmaceutical, Water Treatment and Others in USD Million ........................................................................... 478 Chart 277: Glance at 2012, 2017 and 2022 Japanese Activated Carbon Value Market Share (%) by End-Use Sector – Air Purification, Automotive Canisters, Food & Beverages, Medical & Pharmaceutical, Water Treatment and Others .................................................................... 479 3.6.4 South Korea ............................................... 480 3.6.4.1 Activated Carbon Market Overview by Product Segment ................................................................. 480 Volume Analysis ..................................................... 480 Chart 278: South Korean Activated Carbon Market Analysis (2012-2022) by Product Segment – Granular Activated Carbon (GAC), Powdered Activated Carbon (PAC) and Other Activated Carbons in '000 Metric Tons ............................. 480 Chart 279: Glance at 2012, 2017 and 2022 South Korean Activated Carbon Volume Market Share (%) by Product Segment – Granular Activated Carbon (GAC), Powdered Activated Carbon (PAC) and Other Activated Carbons ... 481 Value Analysis ........................................................ 482 Chart 280: South Korean Activated Carbon Market Analysis (2012-2022) by Product Segment – Granular Activated Carbon (GAC), Powdered Activated Carbon (PAC) and Other Activated Carbons in USD Million ....... 482 Chart 281: Glance at 2012, 2017 and 2022 South Korean Activated Carbon Value Market Share (%) by Product Segment – Granular Activated Carbon (GAC), Powdered Activated Carbon (PAC) and Other Activated Carbons ... 483 3.6.4.2 Activated Carbon Market Overview by Application ............................................................. 484 Volume Analysis ..................................................... 484 Chart 282: South Korean Activated Carbon Market Analysis (2012-2022) by Application – Gas Phase and Liquid Phase in '000 Metric Tons ................................... 484 4. SOUTH AMERICA ............................................. 504 Chart 302: South America Activated Carbon Market Overview (2012-2022) in Volume ('000 Metric Tons) and Value (USD Million) ...................................................... 504 4.1 South American Activated Carbon Market Overview by Geographic Region ............................ 505 Volume Analysis .................................................... 505 Chart 303: South American Activated Carbon Market Analysis (2012-2022) by Region – Argentina, Brazil and Rest of South America in '000 Metric Tons ................... 505 Chart 304: Glance at 2012, 2017 and 2022 South American Activated Carbon Volume Market Share (%) by Region – Argentina, Brazil and Rest of South America ................ 506 Value Analysis ........................................................ 507 Chart 305: South American Activated Carbon Market Analysis (2012-2022) by Region – Argentina, Brazil and Rest of South America in USD Million ........................... 507 Chart 306: Glance at 2012, 2017 and 2022 South American Activated Carbon Value Market Share (%) by Product Segment – Argentina, Brazil and Rest of South America .. 508 4.2 South American Activated Carbon Market Overview by Product Segment .............................. 509 Volume Analysis .................................................... 509 Chart 307: South American Activated Carbon Market Analysis (2012-2022) by Product Segment – Granular Activated Carbon (GAC), Powdered Activated Carbon (PAC) and Other Activated Carbons in '000 Metric Tons ............ 509 Chart 308: Glance at 2012, 2017 and 2022 South American Activated Carbon Volume Market Share (%) by Product Segment – Granular Activated Carbon (GAC), Powdered Activated Carbon (PAC) and Other Activated Carbons .. 510 Value Analysis ........................................................ 511 Chart 309: South American Activated Carbon Market Analysis (2012-2022) by Product Segment – Granular Activated Carbon (GAC), Powdered Activated Carbon (PAC) and Other Activated Carbons in USD Million ....... 511 Chart 310: Glance at 2012, 2017 and 2022 South American Activated Carbon Value Market Share (%) by Product Segment – Granular Activated Carbon (GAC), Powdered Activated Carbon (PAC) and Other Activated Carbons .. 512 4.3 South American Activated Carbon Market Overview by Application ........................................ 513 Volume Analysis .................................................... 513 Chart 311: South American Activated Carbon Market Analysis (2012-2022) by Application – Gas Phase and Liquid Phase in '000 Metric Tons .................................. 513 Chart 312: Glance at 2012, 2017 and 2022 South American Activated Carbon Volume Market Share (%) by Application – Gas Phase and Liquid Phase ....................................... 514 Value Analysis ........................................................ 515 Chart 313: South American Activated Carbon Market Analysis (2012-2022) by Application – Gas Phase and Liquid Phase in USD Million .......................................... 515 Chart 314: Glance at 2012, 2017 and 2022 South American Activated Carbon Value Market Share (%) by Application – Gas Phase and Liquid Phase .......................................... 516 Click here to buy the report Page 10
Activated Carbon – A Global Market Overview Jan 2016 |585 Pages | 367 Charts | Price $4320 4.4 South American Activated Carbon Market Overview by End-Use Sector .................................. 517 Volume Analysis ..................................................... 517 Chart 315: South American Activated Carbon Market Analysis (2012-2022) by End-Use Sector – Air Purification, Automotive Canisters, Food & Beverages, Medical & Pharmaceutical, Water Treatment and Others in '000 Metric Tons ................................................................... 517 Chart 316: Glance at 2012, 2017 and 2022 South American Activated Carbon Volume Market Share (%) by End-Use Sector – Air Purification, Automotive Canisters, Food & Beverages, Medical & Pharmaceutical, Water Treatment and Others .................................................................... 518 Value Analysis ........................................................ 519 Chart 317: South American Activated Carbon Market Analysis (2012-2022) by End-Use Sector – Air Purification, Automotive Canisters, Food & Beverages, Medical & Pharmaceutical, Water Treatment and Others in USD Million ........................................................................... 519 Chart 318: Glance at 2012, 2017 and 2022 South American Activated Carbon Value Market Share (%) by End-Use Sector – Air Purification, Automotive Canisters, Food & Beverages, Medical & Pharmaceutical, Water Treatment and Others .................................................................... 520 4.5 South American Activated Carbon Market Overview by Country ............................................. 521 4.5.1 Argentina ................................................... 521 4.5.1.1 Activated Carbon Market Overview by Product Segment ................................................................. 521 Volume Analysis ..................................................... 521 Chart 319: Argentine Activated Carbon Market Analysis (2012-2022) by Product Segment – Granular Activated Carbon (GAC), Powdered Activated Carbon (PAC) and Other Activated Carbons in '000 Metric Tons ................ 521 Chart 320: Glance at 2012, 2017 and 2022 Argentine Activated Carbon Volume Market Share (%) by Product Segment – Granular Activated Carbon (GAC), Powdered Activated Carbon (PAC) and Other Activated Carbons ... 522 Value Analysis ........................................................ 523 Chart 321: Argentine Activated Carbon Market Analysis (2012-2022) by Product Segment – Granular Activated Carbon (GAC), Powdered Activated Carbon (PAC) and Other Activated Carbons in USD Million ........................ 523 Chart 322: Glance at 2012, 2017 and 2022 Argentine Activated Carbon Value Market Share (%) by Product Segment – Granular Activated Carbon (GAC), Powdered Activated Carbon (PAC) and Other Activated Carbons ... 524 4.5.1.2 Activated Carbon Market Overview by Application ............................................................. 525 Volume Analysis ..................................................... 525 Chart 323: Argentine Activated Carbon Market Analysis (2012-2022) by Application – Gas Phase and Liquid Phase in '000 Metric Tons ........................................................ 525 Chart 324: Glance at 2012, 2017 and 2022 Argentine Activated Carbon Volume Market Share (%) by Application – Gas Phase and Liquid Phase ........................................ 526 Value Analysis ........................................................ 527 Chart 325: Argentine Activated Carbon Market Analysis (2012-2022) by Application – Gas Phase and Liquid Phase in USD Million ................................................................ 527 Chart 326: Glance at 2012, 2017 and 2022 Argentine Activated Carbon Value Market Share (%) by Application – Gas Phase and Liquid Phase .......................................... 528 4.5.1.3 Activated Carbon Market Overview by End- Use Sector .............................................................. 529 Volume Analysis ..................................................... 529 Chart 327: Argentine Activated Carbon Market Analysis (2012-2022) by End-Use Sector – Air Purification, Automotive Canisters, Food & Beverages, Medical & Pharmaceutical, Water Treatment and Others in '000 Metric Tons ................................................................... 529 Chart 328: Glance at 2012, 2017 and 2022 Argentine Activated Carbon Volume Market Share (%) by End-Use Sector – Air Purification, Automotive Canisters, Food & Beverages, Medical & Pharmaceutical, Water Treatment and Others .................................................................... 530 Value Analysis ........................................................ 531 Chart 329: Argentine Activated Carbon Market Analysis (2012-2022) by End-Use Sector – Air Purification, Automotive Canisters, Food & Beverages, Medical & Pharmaceutical, Water Treatment and Others in USD Million ........................................................................... 531 Chart 330: Glance at 2012, 2017 and 2022 Argentine Activated Carbon Value Market Share (%) by End-Use Sector – Air Purification, Automotive Canisters, Food & Beverages, Medical & Pharmaceutical, Water Treatment and Others .................................................................... 532 4.5.2 Brazil .......................................................... 533 4.5.2.1 Activated Carbon Market Overview by Product Segment................................................................. 533 Volume Analysis..................................................... 533 Chart 331: Brazilian Activated Carbon Market Analysis (2012-2022) by Product Segment – Granular Activated Carbon (GAC), Powdered Activated Carbon (PAC) and Other Activated Carbons in '000 Metric Tons ............... 533 Chart 332: Glance at 2012, 2017 and 2022 Brazilian Activated Carbon Volume Market Share (%) by Product Segment – Granular Activated Carbon (GAC), Powdered Activated Carbon (PAC) and Other Activated Carbons .. 534 Value Analysis ........................................................ 535 Chart 333: Brazilian Activated Carbon Market Analysis (2012-2022) by Product Segment – Granular Activated Carbon (GAC), Powdered Activated Carbon (PAC) and Other Activated Carbons in USD Million ....................... 535 Chart 334: Glance at 2012, 2017 and 2022 Brazilian Activated Carbon Value Market Share (%) by Product Segment – Granular Activated Carbon (GAC), Powdered Activated Carbon (PAC) and Other Activated Carbons .. 536 4.5.2.2 Activated Carbon Market Overview by Application............................................................. 537 Volume Analysis..................................................... 537 Chart 335: Brazilian Activated Carbon Market Analysis (2012-2022) by Application – Gas Phase and Liquid Phase in '000 Metric Tons ....................................................... 537 Chart 336: Glance at 2012, 2017 and 2022 Brazilian Activated Carbon Volume Market Share (%) by Application – Gas Phase and Liquid Phase ....................................... 538 Value Analysis ........................................................ 539 Chart 337: Brazilian Activated Carbon Market Analysis (2012-2022) by Application – Gas Phase and Liquid Phase in USD Million ............................................................... 539 Chart 338: Glance at 2012, 2017 and 2022 Brazilian Activated Carbon Value Market Share (%) by Application – Gas Phase and Liquid Phase .......................................... 540 4.5.2.3 Activated Carbon Market Overview by End- Use Sector.............................................................. 541 Volume Analysis..................................................... 541 Chart 339: Brazilian Activated Carbon Market Analysis (2012- 2022) by End-Use Sector – Air Purification, Automotive Canisters, Food & Beverages, Medical & Pharmaceutical, Water Treatment and Others in '000 Metric Tons ............ 541 Chart 340: Glance at 2012, 2017 and 2022 Brazilian Activated Carbon Volume Market Share (%) by End-Use Sector – Air Purification, Automotive Canisters, Food & Beverages, Medical & Pharmaceutical, Water Treatment and Others .................................................................... 542 Value Analysis ........................................................ 543 Chart 341: Brazilian Activated Carbon Market Analysis (2012-2022) by End-Use Sector – Air Purification, Automotive Canisters, Food & Beverages, Medical & Pharmaceutical, Water Treatment and Others in USD Million ........................................................................... 543 Chart 342: Glance at 2012, 2017 and 2022 Brazilian Activated Carbon Value Market Share (%) by End-Use Sector – Air Purification, Automotive Canisters, Food & Beverages, Medical & Pharmaceutical, Water Treatment and Others .................................................................... 544 Brascarbo Industria E Comercio Ltda. (Brazil) – A Major Player ............................................................................ 545 4.5.3 Rest of South America ................................ 546 4.5.3.1 Activated Carbon Market Overview by Product Segment................................................................. 546 Volume Analysis .................................................... 546 Chart 343: Rest of South America Activated Carbon Market Analysis (2012-2022) by Product Segment – Granular Activated Carbon (GAC), Powdered Activated Carbon (PAC) and Other Activated Carbons in '000 Metric Tons .............................................................................. 546 Chart 344: Glance at 2012, 2017 and 2022 Rest of South America Activated Carbon Volume Market Share (%) by Product Segment – Granular Activated Carbon (GAC), Powdered Activated Carbon (PAC) and Other Activated Carbons ........................................................................ 547 Value Analysis ........................................................ 548 Chart 345: Rest of South America Activated Carbon Market Analysis (2012-2022) by Product Segment – Granular Activated Carbon (GAC), Powdered Activated Carbon (PAC) and Other Activated Carbons in USD Million .................... 548 Chart 346: Glance at 2012, 2017 and 2022 Rest of South America Activated Carbon Value Market Share (%) by Product Segment – Granular Activated Carbon (GAC), Powdered Activated Carbon (PAC) and Other Activated Carbons ........................................................................ 549 4.5.3.2 Activated Carbon Market Overview by Application ............................................................ 550 Volume Analysis .................................................... 550 Chart 347: Rest of South America Activated Carbon Market Analysis (2012-2022) by Application – Gas Phase and Liquid Phase in '000 Metric Tons ........................... 550 Chart 348: Glance at 2012, 2017 and 2022 Rest of South America Activated Carbon Volume Market Share (%) by Application – Gas Phase and Liquid Phase .................... 551 Value Analysis ........................................................ 552 Chart 349: Rest of South America Activated Carbon Market Analysis (2012-2022) by Application – Gas Phase and Liquid Phase in USD Million ................................... 552 Chart 350: Glance at 2012, 2017 and 2022 Brazilian Activated Carbon Value Market Share (%) by Application – Gas Phase and Liquid Phase .......................................... 553 4.5.3.3 Activated Carbon Market Overview by End- Use Sector ............................................................. 554 Volume Analysis .................................................... 554 Chart 351: Rest of South America Activated Carbon Market Analysis (2012-2022) by End-Use Sector – Air Purification, Automotive Canisters, Food & Beverages, Medical & Pharmaceutical, Water Treatment and Others in '000 Metric Tons ....................................................... 554 Chart 352: Glance at 2012, 2017 and 2022 Rest of South America Activated Carbon Volume Market Share (%) by End-Use Sector – Air Purification, Automotive Canisters, Food & Beverages, Medical & Pharmaceutical, Water Treatment and Others .................................................. 555 Value Analysis ........................................................ 556 Chart 353: Rest of South America Activated Carbon Market Analysis (2012-2022) by End-Use Sector – Air Purification, Automotive Canisters, Food & Beverages, Medical & Pharmaceutical, Water Treatment and Others in USD Million ............................................................... 556 Chart 354: Glance at 2012, 2017 and 2022 Rest of South America Activated Carbon Value Market Share (%) by End- Use Sector – Air Purification, Automotive Canisters, Food & Beverages, Medical & Pharmaceutical, Water Treatment and Others .................................................................... 557 5. REST OF WORLD .............................................. 558 Chart 355: Rest of World Activated Carbon Market Overview (2012-2022) in Volume ('000 Metric Tons) and Value (USD Million) ...................................................... 558 5.1 Activated Carbon Market Overview by Product Segment ................................................................ 559 Volume Analysis .................................................... 559 Chart 356: Rest of World Activated Carbon Market Analysis (2012-2022) by Product Segment – Granular Activated Carbon (GAC), Powdered Activated Carbon (PAC) and Other Activated Carbons in '000 Metric Tons 559 Chart 357: Glance at 2012, 2017 and 2022 Rest of World Activated Carbon Volume Market Share (%) by Product Segment – Granular Activated Carbon (GAC), Powdered Activated Carbon (PAC) and Other Activated Carbons .. 560 Click here to buy the report Page 11
Activated Carbon – A Global Market Overview Jan 2016 |585 Pages | 367 Charts | Price $4320 Chart 367: Glance at 2012, 2017 and 2022 Rest of World Activated Carbon Value Market Share (%) by End-Use Sector – Air Purification, Automotive Canisters, Food & Beverages, Medical & Pharmaceutical, Water Treatment and Others .................................................................... 570 Value Analysis ........................................................ 561 Chart 358: Rest of World Activated Carbon Market Analysis (2012-2022) by Product Segment – Granular Activated Carbon (GAC), Powdered Activated Carbon (PAC) and Other Activated Carbons in USD Million ....... 561 Chart 359: Glance at 2012, 2017 and 2022 Rest of World Activated Carbon Value Market Share (%) by Product Segment – Granular Activated Carbon (GAC), Powdered Activated Carbon (PAC) and Other Activated Carbons ... 562 5.2 Activated Carbon Market Overview by Application ...... 563 Volume Analysis ..................................................... 563 Chart 360: Rest of World Activated Carbon Market Analysis (2012-2022) by Application – Gas Phase and Liquid Phase in '000 Metric Tons ................................... 563 Chart 361: Glance at 2012, 2017 and 2022 Rest of World Activated Carbon Volume Market Share (%) by Application – Gas Phase and Liquid Phase ........................................ 564 Value Analysis ........................................................ 565 Chart 362: Rest of World Activated Carbon Market Analysis (2012-2022) by Application – Gas Phase and Liquid Phase in USD Million ........................................... 565 Chart 363: Glance at 2012, 2017 and 2022 Brazilian Activated Carbon Value Market Share (%) by Application – Gas Phase and Liquid Phase .......................................... 566 5.3 Activated Carbon Market Overview by End-Use Sector .................................................................... 567 Volume Analysis..................................................... 567 Chart 364: Rest of World Activated Carbon Market Analysis (2012-2022) by End-Use Sector – Air Purification, Automotive Canisters, Food & Beverages, Medical & Pharmaceutical, Water Treatment and Others in '000 Metric Tons ................................................................... 567 Chart 365: Glance at 2012, 2017 and 2022 Rest of World Activated Carbon Volume Market Share (%) by End-Use Sector – Air Purification, Automotive Canisters, Food & Beverages, Medical & Pharmaceutical, Water Treatment and Others .................................................................... 568 Value Analysis ........................................................ 569 Chart 366: Rest of World Activated Carbon Market Analysis (2012-2022) by End-Use Sector – Air Purification, Automotive Canisters, Food & Beverages, Medical & Pharmaceutical, Water Treatment and Others in USD Million ........................ 569 PART C: GUIDE TO THE INDUSTRY ............... 571 1. NORTH AMERICA ............................................ 571 2. EUROPE .......................................................... 574 3. ASIA-PACIFIC ................................................... 575 4. REST OF WORLD .............................................. 583 PART D: ANNEXURE .................................... 584 1. RESEARCH METHODOLOGY ............................. 584 2. FEEDBACK ....................................................... 586 About Industry Experts Industry Experts values the most updated and accurate market research and industry analysis to provide unique market research reports for a broad range of industry verticals including Automotive, Transportation, Healthcare, Pharmaceuticals, Food & Beverages, Chemicals, Plastics, Materials, Consumer Goods, Retail, Biotechnology, Construction, Manufacturing and Other industries. Our research reports help our clients to identify and resolve topical issues by providing a complete picture of the market in their respective industry sectors. The Company’s rich collection of market research reports enable the companies to explore market drivers; forecast the future market; and to formulate the right strategies at the right time. INDUSTRY EXPERTS 1-7-19/C, Street No. 8, Habsiguda Hyderabad – 500007, India Phone: +91-40-4018-1314 Fax: +91-40-4027-2381 info@industry-experts.com industry-experts.com Industry Experts’ leading edge publications makes the life easy for corporate strategists, investors, analysts and researchers, start ups, consultants, financial and banking executives, academicians and many more. The company also provides customized research reports to cater the needs of the industry. More about Industry Experts Click here to buy the report Page 12

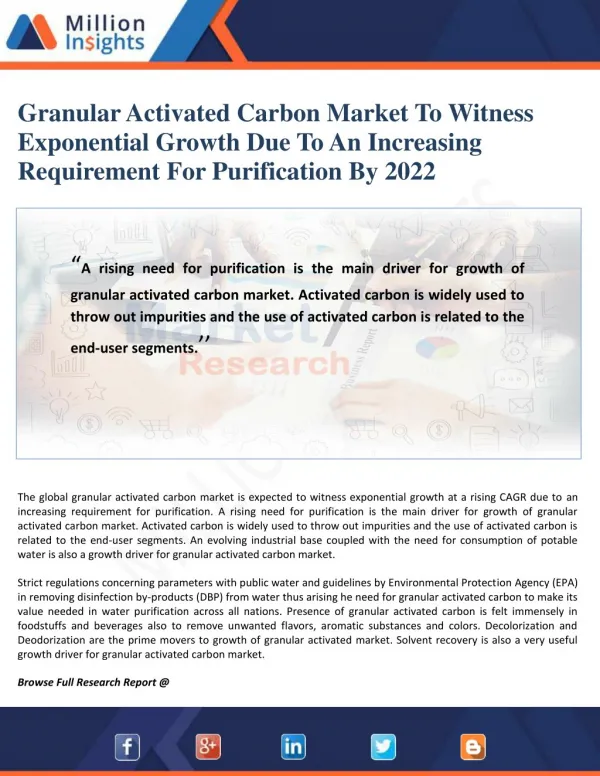
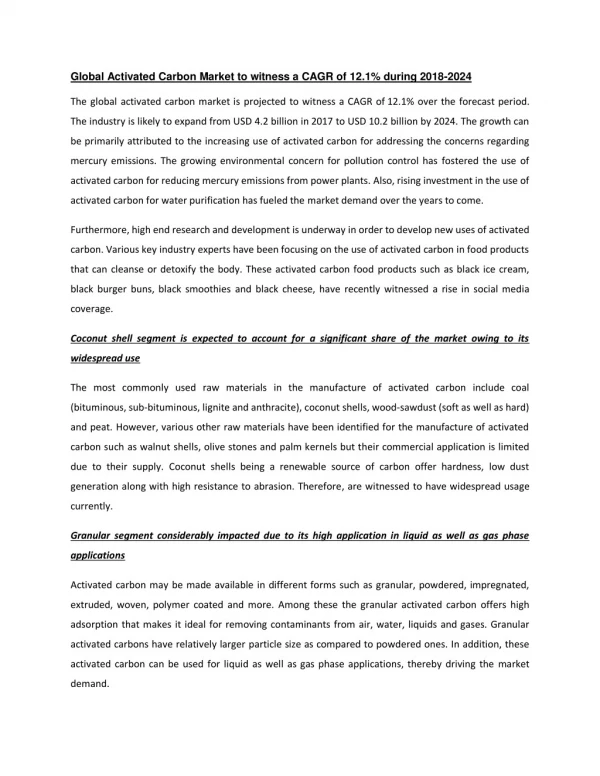
![Activated Carbon Market Size, Share & Growth [2016-2021]](https://cdn5.slideserve.com/9805960/activated-carbon-market-worth-8-12-billion-dt.jpg)