Download
1 / 52
520 likes | 594 Views
Reverend Bayes Sample Sizes and Statistical Analysis. Statisticians. Statisticians are generally ‘power’ mad, that is they want to minimise uncertainty around any effect estimate. Two camps: Frequentists and Bayesians. Frequentists.

E N D
Statisticians • Statisticians are generally ‘power’ mad, that is they want to minimise uncertainty around any effect estimate. • Two camps: Frequentists and Bayesians.
Frequentists • The philosophy underlying most of our statistics is frequentist. • Frequentists produce the ‘null’ hypothesis. The experiment is set up to ‘prove’ the null hypothesis of ‘no difference’. • See themselves as more ‘objective’ and ‘scientific’ than Bayesians.
Frequentist Null hypothesis • This is nonsense! • If we truly believed in the null hypothesis we would not undertake a trial. We would just chose the cheapest treatment or give treatments according to patient preferences. • We usually have an ‘idea’ about the likely effect of a treatment.
Reverend Bayes • A minister who lived in the 18th Century but dabbled in statistics. • Produced Baye’s theorem, which includes prior beliefs in statistical calculations. • Was not published ‘till 20 years after his death - truly ‘publish or perish’.
God and statistics • Frequentists believe the ‘truth is out there’ and we are getting sample estimates of the truth. • Bayes believed only God can know the ‘truth’ and as mere mortals we can only gain probability estimates of the truth, which is why he developed Bayes theorum.
Bayesians • Until recently Bayes’ approach only used in diagnostic testing in health research. • Widely used in other areas. • Not widely used partly because of computational difficulties but also many think it is ‘unscientific’. • More recently computational problems have been largely solved and increased interest in using the method.
Bayesian statistics • The Bayesian approach is attractive as it is similar to everyday decision making. • One uses prior experience to make a judgement and use new data to inform future decisions.
Bayesians vs Frequentists • When we seek to observe a 50% increase or decrease in essence this is a Bayesian approach as we have a prior belief that A may be 50% more effective than B. • If we had a belief in the null hypothesis then the sample size would be infinite to ‘prove’ no difference.
Prior beliefs • Bayesians want to be more explicit about prior beliefs and include these in a design and analysis. • Data would have to be particularly strong to overturn a prior belief or weaker to confirm.
Bayesian Problems • Bayesians argue that one should keep doing a study until the confidence in the results are credible enough to stop the trial. • Problem that one cannot really plan a trial unless we have a prior sample size.
Not Scientific • Prior beliefs may be so incorrect that they could mislead research. Strong prior belief was HRT prevented heart disease. Shown to be untrue. Small trials showing this to be a fallacy would not overturn this strong belief.
GRIT Trial – Bayesian trial • The design of this trial included prior beliefs on the effectiveness of early or late delivery of babies. • Data were analysed every 6 months (without p values) and presented to clinicians in order for them to change their minds and either randomise more patients or stop randomising.
Bayesian analysis • Expect to see more studies using Bayesian methods in the future. • Rapid area of statistical and economic research.
Statistical Outcomes • Two measures of effect. • Dichotomous = yes/no; dead/alive; passed/failed. • Continuous = blood pressure; weight; exam scores.
Binary outcomes • Basically in a RCT we can compare the percentages in the two groups. • If the percentages are significantly different this is due to the intervention.
Continuous outcomes • Scores, such as blood pressure, quality of life, test scores are compared. Usually the mean scores are compared although sometimes the medians are used. • Usually, mean scores have a ‘normal’ or near normal distribution.
Standard deviation • This is calculated by taking the differences of individual scores from the mean squaring these differences and dividing by the number of observations. • The square root is the SD of this.
Effect sizes • The effect size is the difference between means divided by the standard deviation. • If students in Group A have a mean score of 60 vs 50 in Group B and the standard deviation is 20 the effect size is 0.5 (10/20). • Few new health care treatments get effect sizes GREATER than 0.5.
Relative Risks etc • Binary outcomes are often described in relative risk or odds ratios. Relative risk is: if 10/100 events in group A versus 5/100 in group B. A vs B RR = 2 (10%/5%) B vs A RR = 0.5 (5%/10%). • Odds ratios produce similar results for rare events. • Confidence intervals passing through 1 = not statistically significant.
Sample sizes for trials • The bigger the better – size matters in trials. • Most trials approach sample size estimation using a frequentist approach.
Background • Many trials are ‘underpowered’ that is they are too small to detect a difference that is important. • This is commonly referred to as a Type II error. • At least 30% of trials published in major general journals are underpowered. • This is worse among other journals.
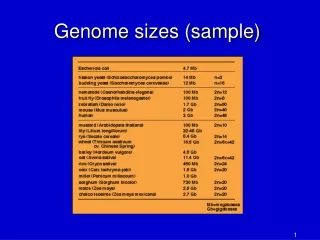
Meta-analysis of Hip Protectors (Ranked by Size) Energy absorbing or unknow types Community Community Nursing Home ‘Shell’ type Protectors Community Community
Hip protector trials • All trials (bar ours of course) were underpowered to detect large (e.g., 50%) reductions in hip fractures. • Small positive trials tended to be published giving an overestimated effect of benefit.
Sample size estimation • Text books usually recommend the following approach to sample size estimation. • Define a clinically important difference in outcome between treatments; • Design an experiment that is sufficiently large to show that such a difference is ‘statistically significant’.
Clinical Significance • The first problem is definition of what is ‘clinically significant’. This is usually unclear. • Any difference of death, for example, is pretty clinically significant. • To power a trial to reduce mortality by 1 death would require an almost infinitely large study.
Epidemiological Significance • A more common justification of sample size is observed effect sizes from epidemiological studies (which may be overestimates). • Or from meta-analyses of smaller trials (which again may over-estimate due to publication bias).
Statistical significance • What is statistical significance? Tradition in medical research states that p = 0.05 or lower is significant. Difference between p = 0.05 and p = 0.06 is trivial, one is significant and the other is not. • Other disciplines, economics, sometimes use p = 0.10.
P values • Originally Pearson constructed p values as a guide not as a cut off. The idea was that given what was known about a treatment (side-effects etc) the p value would add extra information as to whether one should accept the finding. • But p value = 0.05 has become set in stone.
Fallacy of P values • If there is a treatment effect that is not statistically significant p = 0.20 and the null hypothesis is accepted (I.e. there is no difference) you would have only a 20% chance of being correct and 80% of making the wrong decision. • Really one should go for a treatment that the data favours irrespective of the p value.
Significance • BOTH clinical and statistical significance are often arbitary constructs. • ‘Economic significance’ can be less arbitrary. • One can ascertain an economic difference that makes sense. • To demonstrate cost neutrality is a significant endpoint.
Economic Significance • For example, a randomised trial of two methods of endometrial resection was powered to detect a 15% difference in ‘satisfaction’. • Important clinical outcome was re-treatment rates. • An economic difference of significance was about 8% in retreatment rates as this would be cost saving. Torgerson & Campbell BMJ 2000;697.
Endometrial Resection • The trial was only sufficiently powerful to show a 12% difference in retreatment rates. • Trial showed a 4% difference (95% CI of –4% to 11%) but could not exclude an 8% difference. Pinion et al. BMJ 1994;309:979-83.
Forget theory • What normally happens is Clinician says to statistician I can get 70 patients in a trial in a year. • Stato says ‘needs to be bigger’ clinician has a couple of mates who can add 140 more. Statistician calculates difference that 210 participants can show.
What should be done? • For a continuous outcome (e.g. Quality of Life, blood pressure) we should aim to detect AT LEAST half a standardize effect size, which needs 128 participants. • Ideally we need to detect a somewhat smaller difference. • For dichotomous outcome we should have enough power to detect a halving or doubling.
Attrition and clustering • Do not forget to boost sample size to take into account loss to follow-up. • Depending on patient group this might range from 5-30%. • Finally, if it is a cluster trial total sample size needs to be inflated.
How to calculate a sample size • This is easy. Lots of tables or programmes will do this. For continuous outcomes a simple formulae is: take standardised difference and divide the square of this into 32 (80% power) or 42 (90% power). • E.g., 0.5 squared is 0.25 32/0.25 = 128 or 42/0.25 = 168.
For binary outcomes • Look at sample size tables or use programme, but rule of thumb about 800 is needed for 80% power to show 10% difference between 40% and 50% or 50% and 60%. To see 5% difference quadruple sample size.
Cluster trials • For cluster trials we need to inflate the sample size to take into account the ICC of the clusters. 1+(cluster size X ICC) = design effect. • For example, a RCT of adult literacy classes mean size = 8. ICC from a previous trial shows ICC of reading = 0.3.
Cluster sample size • We want to detect 0.5 difference which for an individual RCT = 128 for 80% power. Cluster size = 8 take 1 =7. • 7 x 0.3 = 2.1 + 1 = 3.1 = 397 participants or t 50 clusters of a mean of 8 per cluster.
Analysis • The first analysis that many people do is compare groups at baseline. • Typical many comparisons are made, for example, a paper of a trial in the most recent JAMA (Feb 4, 2004) shows this typical baseline comparison table.
Baseline testing • Of the 24 comparisons 3 were ‘statistically’ significant (I.e, p < 0.05). • What should we do with this information? • Has randomisation failed? • It is useless information and an exercise in futility.
Baseline testing • Assuming randomisation has not been subverted, which in this case looks unlikely, then any differences will have occurred ‘by chance’ they are random differences.
What is wrong with baseline testing? • Baseline testing will ALWAYS throw up chance differences. This can mislead the credulous into believing there is something ‘wrong’ with the study. Also it can mislead some statisticians into ‘correcting’ these baseline imbalances in the analysis.
Baseline variables: What should be done? • Before the study starts specify in advance important co-variates to be used in the analysis (e.g., centre, age) and adjust for these IRRESPECTIVE of whether or not randomisation balances them out.
Interim Data Analysis • This is where the trial is analysed BEFORE completion. • This is done usually for ethical reasons so that a trial can be stopped early if there is an overwhelming benefit or harm. • Women’s Health Initiative trial undertook an interim analysis and the trial was stopped because of harm.
Dangers of Interim Analysis • Sample size calculations assume 1 analysis. Repeated looks at the data WILL showed a significant differences, by chance, even when no difference exists. • The temptation is to stop the trial early when a statistical significance is achieved. • This could be a chance finding.
Interim Analysis • To avoid premature stopping of a trial interim analyses are usually undertaken by an independent committee with experience trialists. • Statistical significance is adjusted to take repeated looks of data into account (so p = 0.01 is significant rather than p = 0.05).