Download
1 / 21
220 likes | 388 Views
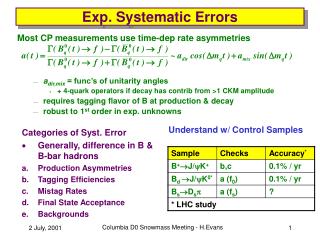
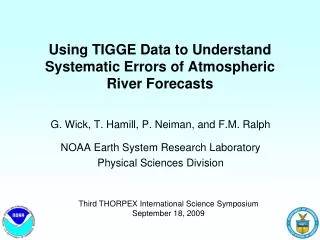
Using TIGGE Data to Understand Systematic Errors of Atmospheric River Forecasts. G. Wick, T. Hamill, P. Neiman, and F.M. Ralph NOAA Earth System Research Laboratory Physical Sciences Division. Third THORPEX International Science Symposium September 18, 2009. Outline. Introduction/Motivation

E N D
Using TIGGE Data to Understand Systematic Errors of Atmospheric River Forecasts G. Wick, T. Hamill, P. Neiman, and F.M. Ralph NOAA Earth System Research Laboratory Physical Sciences Division Third THORPEX International Science Symposium September 18, 2009
Outline • Introduction/Motivation • Data and Tools • Model Evaluations • Conclusions
Zhu & Newell (1998) concluded in a 3-year ECMWF model diagnostic study: • 95% of meridional water vapor flux occurs in narrow plumes in <10% of zonal circumference. • There are typically 3-5 of these narrow plumes within a hemisphere at any one moment. • They coined the term “atmospheric river” (AR) to reflect the narrow character of plumes. Given the above: ARs are very important from a global water cycle perspective.
Atmospheric river Relationship to Precipitationand Flooding
Objectives/Research Questions • Are atmospheric rivers well represented in the model analyses and forecasts within TIGGE? • Is the width of the features accurate and is this dependent on the model resolution? • Are the frequency of the events accurately forecast? • Does this vary with forecast lead time? • Is there any apparent bias in the model forecasts of total precipitable water? • Is there a benefit in resolving atmospheric rivers through ensemble forecasts
Data • TIGGE Control Forecasts of Total Column Water • ECMWF • UK Met Office • JMA • CMC • 12 Z initialization • 0, 3, 5, 7, and 10-day lead times • Satellite retrievals of integrated water vapor from SSM/I • 12-hour grids centered at forecast time • Multiple retrieval algorithms implemented • Analysis here for October 2007 – March 2008 • Northeastern Pacific Region (15-55 N, 110-160 W)
“Bias” Adjustment • Mean analysis total water adjusted to match observed precipitable water over full Pacific • Accounts for forecast biases and differences between total column and precipitable water • Critical for threshold-based identification
Illustrating the Idea 18 hour lead 114 hour lead 66 hour lead 162 hour lead ECMWF Comparison against observations on 5 June 2007 at 6Z
16-Feb-04; p.m. comp. North coast IWV >2cm: >2000 km long South coast IWV >2cm: <1000 km wide 1000 km SSM/I Integrated water vapor (cm) Atmospheric River Identification
Objective River Identification Procedure • Isolate top of the tropical water vapor reservoir • Threshold IWV values at multiple levels and compute gradients • Cluster points and compute skeleton to estimate river axis • Identify points satisfying width criteria • Cluster center points to identify segments of sufficient length • Determine if river intersects land or is potentially influenced by data gaps
Application to Verification of TIGGE • SSM/I Derived IWV for 16 November 2007 • ECMWF 120-hour forecast valid on 16 November 2007
Reproduction of Event Frequency • Results searched to find days with at least one AR within the domain • Days where observations potentially influenced by gaps in coverage removed from record • Results expressed as % change from observation • 100 AR days observed over season General overestimate observed
Prediction of Specific Events Probability of Detection False Alarm Rate
Representation of AR Width • Compared width on days where 1 event was both observed and predicted • Average computed over entire length of AR ECMWF, 0 Lead
Representation of AR Core Strength • Results similarly computed for average peak core strength along length of AR ECMWF, 0 Lead
Predictability of Landfalling Events Probability of Detection False Alarm Rate
Conclusions to date Objective river identification and characterization tool developed to facilitate quantitative results Atmospheric rivers generally well-predicted in TIGGE models Apparent over prediction of frequency No significant bias in width or core strength Models generally similar in performance for predicting atmospheric rivers Need to further explore sensitivity to observations Ultimately can explore potential benefit of resolving atmospheric rivers through ensemble forecasts
Atmos. river 400 km • Observational studies by Ralph et al. (2004, 2005, 2006) extend model results: • Long, narrow plumes of IWV >2 cm measured by SSM/I satellites considered proxies for ARs. • These plumes are typically situated near the leading edge of polar cold fronts. • P-3 aircraft documented strong water vapor flux in a narrow (400 km-wide) AR (along AA’). • Airborne data also showed 75% of the vapor flux was below 2.5 km MSL. • Moist-neutral stratification <2.8 km MSL, conducive to orographic precip. boost & floods.
Accuracy of the Satellite IWV Products • Recently completed independent accuracy assessment with GPS radio occultation data from COSMIC • Results suggest rms accuracy around 2.5 mm
Primary Extracted Characteristics • Number of rivers present in scene • Location of center points along core of river • Width of river at all points along axis and average width • Core IWV values along axis • Orientation of river at all points along axis