Download
1 / 32
320 likes | 491 Views
g -Ray Emission Probabilities Edgardo Browne Decay Data Evaluation Project Workshop May 12 – 14, 2008 Bucharest, Romania. Photon energy and intensity Transition energy and intensity Relative and absolute intensities. Photon energy and intensity. Guidelines

E N D
g-Ray Emission ProbabilitiesEdgardo BrowneDecay Data Evaluation Project WorkshopMay 12 – 14, 2008Bucharest, Romania
Photon energy and intensity Transition energy and intensity Relative and absolute intensities
Photon energy and intensity Guidelines When possible use evaluated values: Recommended standards for g-ray energy calibration (1999), R.G. Helmer, C. van der Leun, Nucl. Instrum. and Methods in Phys. Res. A450, 35 (2000) Update of X-ray and gamma-ray decay data standards for detector calibration and other applications. IAEA - Report, Vienna 2007.
Guidelines Weighted averages of values from the same type of measurements (e.g. with Ge detectors). The uncertainty on the average (recommended) value should not be smaller than the smallest input uncertainty. For discrepant data use the “Limitation of Relative Statistical Weight” method (Program LWEIGHT).
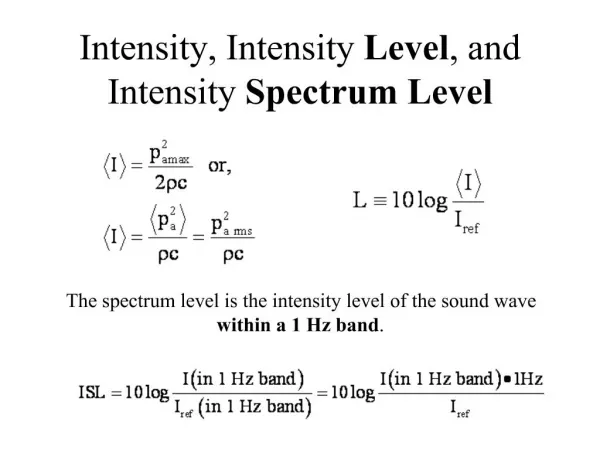
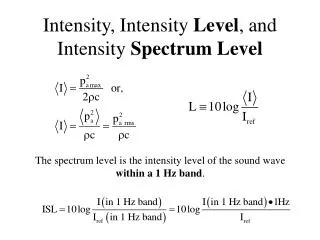
Transition Energy ET = Eg + ER, where ER = Eg2/2 MRc2 is the nuclear recoil energy Egis the photon energy (in MeV) MR~ A is the mass of the daughter nucleus MR c2 ~ 931.5 x A
Transition Intensity IT = Ig (1 + a), where Ig is the photon intensity, a is the total conversion coefficient (theoretical interpolated value)
Relative and Absolute Intensities Relative intensities (relative to the intensity of the strongest g ray, usually taken as 100). Also called relative emission probabilities. Absolute intensities (per 100 disintegrations of the emitting radionuclide, usually given in %). Also called absolute emission probabilities, usually given “per decay.”)
1993Al15, 1994En02 2000He14 Fitted Eg(keV) Eg(keV) Eg(keV) Unevaluated Evaluated 2173.334 (18) 2173.319 (15) 2173.319 (15) 2189.631 (9) 2189.616 (6) 2189.616 (6) 2213.19 (11) 2213.181 (9) 2213.181 (9) 2265.86 (24) 2265.84 (24) 2292.188 (13) 2292.171 (13) 2341.691 (11) 2341.673 (11) 2393.153 (10) 2393.129 (7) 2393.129 (7) 2422.544 (9) 2422.525 (7) 2422.525 (7) 2433.826 (18) 2433.807 (18) 2467.99 (7) 2467.97 (7) 2492.44 (3) 2492.42 (3) 2537.11 (5) 2537.09 (5) 2588.573 (13) 2588.553 (13) 2631.46 (9) 2631.44 (9) 2698.94 (5) 2698.92 (5) 2713.75 (5) 2713.73 (5) 2751.852 (6) 2751.835 (5) 2751.835 (5) 2780.12 (18) 2780.095 (16) 2780.095 (16) 2785.7 (3) 2785.7 (3) 2802.8 (5) 2802.8 (5) 2843.153 (16) 2843.130 (16) 66Ga g-ray energies
Absolute g-Ray Emission Probabilities Ice(1039g)/Ib+(gs) = 2.08 (10)x10-4 (experimental, 1960Sc06) Ib+(gs)/S Ibi+ = 0.8697 (experimental, 1960Sc06) Ice(1039g,E2)/Ig(1039g) = 2.69 (8)x10-4 (Theory, 1978Ro22) Therefore Ig(1039g)/ S Ibi+ = 2.08 (10)x10-4 x 0.8697/ 2.69 (8)x10-4 =0.67(4) Also S Ibi+/ S Iei = 1.265 (from decay scheme and theoretical Ibi+/Iei). Since S Ibi+ + S Iei = 100%, then S Ibi+ = 55.8 (24)%, and Ig(1039g) = 0.67 (4) x 55.8 (24) = 37 (3)%
233Pa b- decay Ig(312) = 38.6 (5) % (experimental value, Gehrke et al.) SI(g+ce) (gs) = 102 (2) % b- 5-12%
What went wrong? Eg(keV)aT(exp.) aT(theo. M1) 300 0.83 (2) 1.04 312 0.79 (2) 0.96 340 0.61 (2) 0.75 Answer: Nuclear penetration effects
Using X rays to normalize a decay scheme 231U g-ray spectrum
Ig(25)=100 (6) Ig(84)=50 (3) EC(K)/EC(Total) = 0.59 IKX=390 (14) wK = 0.972 BK=115.6 keV, thus most K-x rays originate from vacancies produced by the electron-capture process. Total vacancies = IKX EC(Total) / wK EC(K) = 680 (33) Normalization factor N = 100 / 680 (33) = 0.147 (7) Ig(25)=100 (6) x 0.147 (7) = 15 (1)% Ig(84)=50 (3) x 0.147 (7) = 7.5 (6)%
192Ir b- and electron capture decay Eg(keV) Iga Ig (1+a) 206 4.01 (6) 0.305 (9)5.23 (8) 489 0.527 (9) 0.0242 (7)0.540 (9) S= 5.77 (8) 316 100.0 (5) 0.085 (3)108.5 (6) 468 57.76 (20) 0.0294 (9)58.43 (20) 612 6.365 (25) 0.0155 (5)6.464 (25)S= 114.9 (6)
The normalization factor is: N = 100 / [Ig(489) (1+a489) + Ig(206) (1+a206) + Ig(316) (1+a316) + Ig(612) (1+a612)] = 100 / 120.7 (7) = 0.828 (5) N = 0.828 (5) The electron capture (e) and b- decay branchings are: e= 100 [Ig(489) (1+a489) + Ig(206) (1+a206)] /120.7 (7) = 100 / [1 + (Ig(316) (1+a316) + Ig(612) (1+a612)/(Ig(489) (1+a489) + Ig(206) (1+a206)) = 100 / [1 + 114.9 (6)/5.77 (8)] = 100 / 20.9 (3) = 4.78 (7)% b-= 100 – EC = 100 – 4.78 (7) = 95.22 (7)% b- = 95.22 (7)% e = 4.78 (7)%
125Sb Decay Scheme It takes about a year for the intensity of the 109-keV g ray to be in equilibrium (within 1%) with the other g rays. The intensity of the 35-keV g ray is also affected by the 58-year half-life of the 144-keV 125mTc isomer.
Decay Scheme Normalization • [S Igi (1 + ai) (gs and 144-keV level)]N =100% • N = 0.2955 (24) • The equilibrium correction for Ig(109) is [T1/2(125Sb) – T1/2(125mTe)/ T1/2(125Sb) ]= 0.943. b- feeding to the 144-keV 125mTe isomer • Ib-=[Ig(109)(1+a109) x 0.943 – Ig(176) (1+a176) – Ig(380)(1+a380) – Ig(497)(1+a497)] N • Ib-= 13.4%
Decay Branching Ratios Assuming EC(gs) = b-(gs) = 0%
g-ray transition intensity balance The corresponding normalization factor is N = 100 / S[ Ii(out) + Ii(gs) – Ii(in)] = 100 / S[ Ii(out) – Ii(in)] + S Ii(gs), but S[ Ii(out) – Ii(in)] = 0, therefore N = 100 / S Ii(gs) Ii(in) Ibi Ii(out) Ii(gs) 0
Uncertainties of Absolute g-Ray Emission Probabilities Deduced from Decay Scheme I1+ dI1 I2+ dI2 b- (I1 + I2) N = 100% N = 100 / (I1 + I2)
The absolute emission probabilities are I1(%) = 100 x I1/(I1 + I2) I2(%) = 100 x I2/(I1 + I2), Their uncertainties have the same value, irrespective of their values in the relative emission probabilities!! dI1(%)2=dI2(%)2= 104 x (I12 dI22+I1dI22)/(I1+I2)2
If I1 = I2 = I, and dI1 = dI2 = dI, then dI1(%)/I1(%) = dI2(%)/I2(%) = [(2)1/2/2] dI/I The fractional uncertainties are smaller than those in the corresponding relative spectral emission probabilities!! See Nucl. Instr. and Meth. In Phys. Res. A249, 461 (1986) for general mathematical formulae.
240Am EC Decay to 240Pu 50.8 h 3- 0 240 Am e >98% 3+ 1031 988 889 E2 E2 (<1% M1) e <1% 4+ 142 99 – E2 e <1% 2+ 43 43 – E2 6561 y 0+ 0 240 Pu
Normalization Procedures • Assumes e(43) < 1%, e(142) < 1%, and • S Tg(GS, 43, 142) > 98% (= 99 + 1%) • Ig(988) = 72.4 + 0.9 % 2. Assumes just e(43) < 1%, and • S Tg(GS, 43) > 99% (= 99.5 + 0.5%) • Ig(988) = 72.0 + 0.6 % • Recommended value • Ig(988) = 72.2 + 0.6 %
OUTPUT: Absolute g-Ray Intensities REPORT FILE Current date: 03/09/2008 240AM EC DECAY NR= 0.984 13 BR= 1.00 FOR INTENSITY UNCERTAINTIES OF GAMMA RAYS NOT USED IN CALCULATING NR, COMBINE THE UNCERTAINTY IN THE RELATIVE INTENSITY IN QUADRATURE WITH THE UNCERTAINTY IN THE NORMALIZING FACTOR (NR x BR). FOR THE FOLLOWING GAMMA RAYS: E= 42.87 4 %IG=0.1092 24 PER 100 DECAYS. E= 98.9 1 %IG=1.486 23 PER 100 DECAYS.(Compare with 1.49 3) E= 152.4 10 %IG=0.012 3 PER 100 DECAYS. E= 555.4 10 %IG=0.010 5 PER 100 DECAYS.(Compare with 0.010 5) E= 597.40 7 %IG=0.006 3 PER 100 DECAYS. E= 507.9 10 %IG=0.071 6 PER 100 DECAYS. E= 606.7 10 %IG=0.069 8 PER 100 DECAYS.(Compare with 0.069 8) E= 447.8 10 %IG=0.013 4 PER 100 DECAYS. E= 600.7 10 %IG=0.014 6 PER 100 DECAYS. E= 251.8 10 %IG=0.0049 20 PER 100 DECAYS. E= 303.7 10 %IG=0.0089 20 PER 100 DECAYS. E= 758.61 8 %IG=0.01033 13 PER 100 DECAYS. E= 857.48 10 %IG=0.00394 5 PER 100 DECAYS. E= 900.37 10 %IG=0.001476 19 PER 100 DECAYS. E= 916.1 2 %IG=0.089 6 PER 100 DECAYS.(Compare with 0.089 6) E= 249.7 10 %IG=0.020 3 PER 100 DECAYS. E= 343.7 10 %IG=0.048 5 PER 100 DECAYS. E= 697.8 %IG=0.034 8 PER 100 DECAYS. E= 959.3 3 %IG=0.038 5 PER 100 DECAYS.(Compare with 0.038 5) E= 382.1 10 %IG=0.052 5 PER 100 DECAYS. E= 888.85 5 %IG=24.7 5 PER 100 DECAYS. E= 987.79 6 %IG=72.0 6 PER 100 DECAYS.(Compare with 72.0 14) E= 934.6 5 %IG=0.025 3 PER 100 DECAYS.