Download

1 / 40
400 likes | 502 Views
Dr. Alasdair S. Brown, Technical Manager at EPS Americas Inc., presents strategies for gas-lift optimisation in Latin America and the Middle East, focusing on single well and field-wide approaches with case studies. Learn about online vs. offline methods and the benefits of automation. Discover how to optimize gas-lift systems for sustainable production and increased value.

E N D
Online Field-Wide Gas-lift Optimisation Dr Alasdair S Brown Technical Manager EPS Americas Inc 1
Presentation Structure • Introduction • Single Well vs Field Wide • Online vs Offline • Case Studies • Latin America • Middle East • Conclusions • Questions 2
Single Well • Single Well Gas Lift Optimisation • Valve Spacing • Injection Depth • Valve Performance • GL Injection Pressure • Qgaslift • CHP 3
Single Well • Conditions change • GL is inherently flexible • Design in flexibility • Single well optimum • Well performance curve • Different for each well • Not necessary optimal for system 4
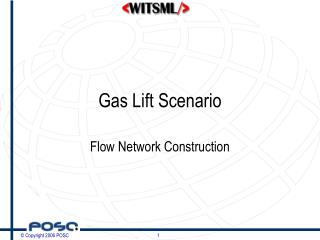
Gas Lift Optimisation Well Well Well Well Gas Lift Compressor Common Pressure Equal Gradients Method 5
Field Wide Optimisation • Field Wide Gas Lift Optimisation • Distribution of Gas to competing wells • Pressure losses in gas lift distribution system • Pressure losses in production system • “Closing the Loop” • Total system modelling • including produced gas reinjection • Compressor performance • Offline/Online 6
Why Online? • Large Number of Wells • Complex optimisation problem • Reduce cycle time • Optimisation-to-implementation • Engineer’s time concentrated on value adding tasks • Goals • Automate Process • Automate Repetitive Tasks • Optimise 7
Simple Manual Optimisation Complex Manual Optimisation (Offline GLO) Complex Automated Optimisation (Online GLO) Sustainable Production Optimisation Increased Value Over ‘Do Nothing’ Time 8
Automation & Optimisation • Off-line • Data input manually into system model • Results from system model implemented manually • Open loop • Data input automatically into model from SCADA • Results from model implemented manually • Closed loop • Data input automatically into model from SCADA • Results from model implemented automatically via set point controllers • Operator review may be required to ensure that implemented results are “sensible” 9
Off-line Optimisation Data Output Manual Data Input Optimiser • OPERATOR • Advice • Approval • Implementation Field 10
Open Loop Optimisation Data Output Automatic Data Input Optimiser • OPERATOR • Advice • Approval • Implementation Field 11
Closed Loop Optimisation Automatic Data Input Optimiser Data Output • OPERATOR • Advice • Approval • Implementation Field Setpoint Controllers 12
Case 1: PdVSA On-Line • SCADA data automatically loaded to give current block valve and compressor status and to constrain the optimisation to stay close to existing operating conditions • Price/cost and equipment constraint data loaded from Corporate databases • Gas injection well set-points sent directly to SCADA controllers (after production operator review as a block) • Recommended pressure control valve set-points and compressor operating conditions sent to production operators in open-loop advisory messages • Results stored in central database for access by other applications. 13
PdVSA Systems Overview CENTINELA, SIAL, SICOT.. CIS ASMS, WTO, NN, OM&S, IS OPTIMISATION SCADA CENTRAL CONTROL RTU, PLC.. PROCESS CONTROL 14
PdVSA Online GLO GLO Corporate Systems Optimisation Central Control Process Control 17
The Online GLO Application Database Corporate Systems Input Output Optimiser Input Output Optimisation SCADA Central Control RTU/PLC Process Control 18
GLO Approval at Supervisory level GLO is executed... The results are evaluated... Gas Lift Well Mini Plantas The SCADA Operator accepts the gas lift rates and carries out adjustments Gas lift rates and recommendations download to SCADA Compressors Online GLO Daily Operation 19
La Salina Online Flowgroup Performance Surfaces Tuned Well Models Wellhead Performance Curve Generate Operating Pt LP Gas Gathering Network Wells in Flowgroups HP Gas Lift Network Complete Network 22
POIS • POIS = Production Operation Information System • Northern fields of Kuwait • Performed by consortium including EPS, Aspentech, Daelim • EPS role was to provide the optimization software, software integration and detailed engineering models for five fields in North Kuwait. • The fields included 197 wells (411 well strings) • 33 water injectors, • 91 gas lifted producers and • 30 produced with ESPs. • The wells and fields are connected through a complex network allowing wells to be switched between high, medium and low pressure as well as ‘wet’ and ‘dry’ separator trains • Total production 600 Mstb/day 25
Design Brief • Hydraulic model of GL Distribution System • Compressor Station behaviour and Performance • Power turbines, compression, gearboxes, intercoolers, gas recycling • Surge and stonewall constraints • Multiphase Flow • Scalable to >1000 wells • Optimise non-hierarchical networks • Online Integration with • Production Management System • DCS/SCADA System 26
Objectives • Data acquisition via SCADA to MIS (Aspentech) • GL optimisation for new GL wells • GL being installed following water injection • Automatic acquisition of WT data • Automatic well model recalibration • Automatic online GL optimisation calculation • Manual setting of optimised setpoints (initially) 27
PAS Concept POIS Data Transfer Past data PAS New WellFlo Engineer Compare with Well Fail Well Model intervention Test trend Pass Rerun or retune Automatic Model Retune Manual Model Retune Rerun Welltest 28
GLO Concept POIS GLO ReO System Model Network model Wells Wells Wells Wells Wells Get Generate Convert to Initiate New Settings Updated well Run GLO choke GLO run New gas allocation well models performance settings 29
Implementation • Well modelling of all 411 wells (WellFlo) • Construction and tuning of network Model (ReO) • Automatic tuning of Well models • Automatic GL optimisation • Integration with Aspentech MIS • Model maintenance and development 30
Important Issues Identified • Data Quality • Well data • production data • Surface network data • Business processes • building use of POIS model into std. procedures • model maintenance • model enhancement • Compressor optimisation • Multistage separation optimisation 31
Individual fields (viz., RA, SA, RQ, AD & BH) modelled as separate sub-sheets All fields interconnected through 3 Gathering Centres: GC-15, GC-23, and GC-25 Each GC has 7 headers that can take inflow from any or all wells Network Config Modelling 32
Multiple GC & MF options for all the wells made network very flexible to accommodate any future flow path definition Optimiser easily handled this huge network - over 40,000 objects! Network Config Modelling 33
SCADA & POIS FINDER WELL INFORMATION Business Process Explorer GUI Hydrocarbon Accounting Material Balance GLO PMDB ALTAMEER (POIS) PAS User Maintain Well Models (Administration of) WellFlo Reo & WellFlo GC RTDB (POIS) All DCS DATA TRANSFERRED RADIO LINK Well Head Pressure From 217 Wells GC SCADA GC DCS 34
Network Config Modelling 378 producers with choice of producing into any of 3 GCs through any of 21 MFs Abdali: 16 Wells to 2 GC via 13 6in lines Ratqa: 20 Wells to 2 GC via 36in & 10in lines Sabriyah: 142 Wells to 1 GC thru’ 7 MF Raudhatain: 195 Wells to 3 GC thru’ 7 MF each Bahra: 5 Wells to 1 GC thru’ 7 MF 36
Network Config Modelling Lift gas to SA field Lift-Gas System 5x7 Possible inputs from RQ & AD fields 9 Sub-sheets holding 20-25 wells each 7x3 MF interconnecting all 194 wells across the field 7x3 MF outlets to production terminals 38
Network Config Modelling Multi-header choice for lift-gas at present & for future Multi-MF choice for production at present and for future NP & GLwells (FG) 39
Conclusions • KOC currently producing to quota • Current capacity higher than quota • (how much higher is unknown) • However additional production can be allocated to NK • Cost reduction is additional benefit • Reduction in admin overhead • Reduction in flaring • Potential reduction in new well requirement • Network reconfiguration • Work practices need to change to extract full value from the system 41
POIS project • Client - Kuwait Oil Company • Year of Contract Award – 2000 • Projected Value Generated: • $100 million - $175 million per annum (projected) 42
Questions? 43