Download
1 / 36
360 likes | 568 Views
Linkage Analysis with Ordinal Data: Sex-limitation. Michael Neale, Marleen De Moor & Sarah Medland Thanks to Fruhling Rijsdijk, Kate Morley et al whose slides we ripped off. Boulder CO International Workshop March 8 2007. Background of ordinal trait modeling

E N D
Linkage Analysis with Ordinal Data: Sex-limitation Michael Neale, Marleen De Moor & Sarah Medland Thanks to Fruhling Rijsdijk, Kate Morley et al whose slides we ripped off Boulder CO International Workshop March 8 2007
Background of ordinal trait modeling Introduction to sex-limitation theory Practical on sex-limited linkage analysis: Dutch twins’ exercise participation Overview
Ordinal data Measuring instrument is able to only discriminate between two or a few ordered categories e.g. absence or presence of a disease. Data take the form of counts, i.e. the number of individuals within each category: ‘yes’ ‘no’ Of 100 individuals: 90 ‘no’ 10 ‘yes’ 55 19 ‘no’ ‘yes’ 8 18
Assumptions: (1) Underlying normal distribution of liability (2) The liability distribution has 1 or more thresholds (cut-offs) Univariate Normal Distribution of Liability
Liability is a latentvariable, the scale is arbitrary, distribution is, therefore, assumed to be a Standard Normal Distribution (SND) or z-distribution: mean() = 0 and SD () = 1 z-values are the number of SD away from the mean area under curve translates directly to probabilities > Normal Probability Density function () 68% -2 3 - 0 1 1 2 -3 The standard Normal distribution
In an unselected sample of sib pairs > Contingency Table with 4 observed cells: cell a:number of pairs concordant for unaffected cell d: number of pairs concordant for affected cell b/c: number of pairs discordant for the disorder Twin1 Twin2 0 1 545 (.76) 75 (.11) 0 56 (.08) 40 (.05) 1 Two categorical traits:Data from siblings 0 = unaffected 1 = affected
Assumed to follow a bivariate normal distribution, where both traits have a mean of 0 and standard deviation of 1, but the correlation between them is unknown. The shape of a bivariate normal distribution is determined by the correlation between the traits Joint Liability Model for sib/twin pairs
Bivariate Normal r =.90 r =.00
Bivariate Normal (R=0.6) partitioned at threshold 1.4 (z-value) on both liabilities
How are expected proportions calculated? By numerical integration of the bivariate normal over two dimensions: the liabilities for twin1 and twin2 e.g. the probability that both twins are affected : Φ is the bivariate normal probability density function, L1and L2 are the liabilities of twin1 and twin2, with means 0, and is the correlation matrix of the two liabilities T1 is threshold (z-value) on L1, T2 is threshold (z-value) on L2
(0 0) (1 1) (0 1) (1 0)
How is numerical integration performed? There are programmed mathematical subroutines that can do these calculations Mx uses one written by Alan Genz
Expected Proportions of the BN, for R=0.6, Th1=1.4, Th2=1.4 Liab 2 0 1 Liab 1 .87 .05 0 .05 .03 1
Twin2 Twin1 0 1 a b 0 c d 1 How can we estimate correlations from CT? The correlation (shape) of the bivariate normal and the two thresholds determine the relative proportions of observations in the 4 cells of the contingency table. Conversely, the sample proportions in the 4 cells can be used to estimate the correlation and the thresholds. c c d d a b b a
Summary It is possible to estimate a tetrachoric correlation between categorical traits from simple counts because we assume that the underlying joint distribution is bivariate normal The relative sample proportions in the 4 cells are translated to proportions under the bivariate normal so that the most likely correlation and the thresholds are derived Next: use correlations in a linkage analysis
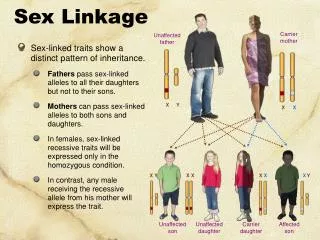
Heterogeneity Females Males
Var F, Cov MZF, Cov DZF af, df, ef Var M, Cov MZM, Cov DZM am, dm, em Var Fdzo = Var F, Var M dzo = Var M Cov DZO rg (but still pihat) What about DZO?
Data: Exercise participation • Dutch sample of twins and their siblings • N=9,408 individuals from 4,230 families • Binary phenotype: • Exercise participation: Yes/No • (Criterion: 60 min/week at 4 METs)
Genotyped sub sample • Sub sample was genotyped • N=1,432 sibling pairs from 619 families (MZ pairs excluded) • (266 MM, 525 FF, 328 MF and 313 FM sib pairs) • Genotypic information: • based on 361 markers on average (10.6 cM spacing) • IBD probabilities estimated at 1 cM grid in Merlin (multipoint) • Pihat calculated in Mx with formula: • Pihat=0.5*p(IBD=1)+1*p(IBD=2)
Heritability in total sample Heritability estimates: Males: A69.4%E30.6% Females: A55.7%E44.3% Genetic correlation OS pairs: 0.27 Thus: partly different genes affect exercise participation in males and females
Path model rAr,OS EM Ar,M Q Q Ar,F EF eM aM qM qF aF eF LIABEX, M LIABEX, F EXM EXF
Mx script G2: Data from genotyped male-male sibling pairs Data NInput=346 Ord File=c19mm.dat … … Thresholds M +(S|R)*B ; Covariances A+E+Q | H@A+P@Q _ H@A+P@Q | A+E+Q ; …
Mx script G1: Calculation group Data Calc NGroups=7 Begin Matrices ; X Lower 1 1 Free ! female genetic structure Z Lower 1 1 Free ! female specific environmental structure G Full 1 1 Free ! female qtl U Lower 1 1 Free ! male genetic structure W Lower 1 1 Free ! male specific environmental structure F Full 1 1 Free ! male qtl … Begin Algebra; A = U*U'; ! male genetic variance E = W*W'; ! male specific environmental variance Q = F*F'; ! male qtl variance V = A+E+Q; ! male total variance P = K*I; ! calculates pihat End Algebra ; …
Mx script G6: constraint males: total variance=1 Constraint Begin matrices = Group 1; J unit nvar 1 End matrices; Constraint V=J; option no-output END …
Exercise • Run the script AEQc19.mx for position 11 on chromosome 19 • Modify the script to test: • for sex heterogeneity at QTL • significance of QTL males • significance of QTL females • Obtain chi2 in the output and compute LOD scores for females and males with formula: • LOD=chi2/4.61 • If you have time, repeat this for another position on chromosome 19
Solution Modify the script: G5 … Option Multiple Issat END … Save full.mxs Get full.mxs !Test for sex heterogeneity Equate F 1 1 1 G 1 1 1 END Get full.mxs !Test for significance female QTL Drop G 1 1 1 END Get full.mxs !Test for significance male QTL Drop F 1 1 1 END
Solution Results from Mx output:
Results whole genome Males: Females:
Issues • Power to detect linkage (or heritability) with ordinal data is lower than with continuous data • Power to detect sex heterogeneity at QTL also low • Unclear what is best way to test sex-specific QTLs • QTL variance is overestimated, leads to strange estimates in different parts of the model (aF, aM, rA,OS) • Sex-limitation only considered here, but model applies to GxE generally.
More advanced scripting Sarah Medland (2005) TRHG • Efficient script to model sex-limited linkage, only 1 datagroup • Both continuous and ordinal data • Especially convenient when sibships are larger than 2
THE 20th ANNIVERSARY INTERNATIONAL WORKSHOP ON METHODOLOGY OF TWIN AND FAMILY STUDIES October 1 - 5, 2007 Leuven, Belgium