Download
1 / 14
140 likes | 282 Views
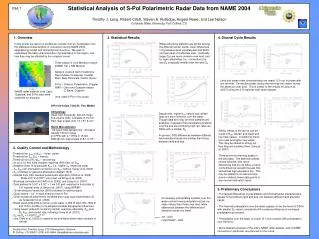
An assessment of the NRLMSISE-00 density thermosphere description in presence of space weather events C. Lathuillère and M. Menvielle. The data and the method Statistical analysis for year 2004 8 larger events of 2004 Conclusion. STAR/CHAMP densities – May 3 rd , 2003. to the sun.

E N D
An assessment of the NRLMSISE-00 density thermosphere description in presence of space weather eventsC. Lathuillère and M. Menvielle • The data and the method • Statistical analysis for year 2004 • 8 larger events of 2004 • Conclusion
STAR/CHAMP densities – May 3rd, 2003 to the sun Densities (10-15 g.cm-3) STAR/CHAMP densities – May 3rd, 2003 The data Inclination:87° STAR atmosphere density along CHAMP trajectory at about 400 km altitude … between -50° and 50° in latitude, with a 1° sampling rate with respect to the latitude ~5:30 pm LT at equator Densities (10-15 g.cm-3) daytime and night time orbit sections are considered separately ~5:30 am LT at equator
The method: Running SVD analysis over 15 consecutive orbits (about 1 day) 10 LT TOTAL MASS DENSITY at the satellite altitude (10-15 g/cm3) 22 LT The projection on the first component accounts for large scale variations: spatial variations are captured by the first principal component, and time variations are captured by the associated projection coefficient: C1. Residuals account for smaller scales, as tides and gravity waves
Comparison with NRLMSISE-00 model CHAMP data NRLMSIS: with MgII proxy and ap NRLMSIS_quiet: with MgII proxy and Ap=4 Normalized coefficient: C1 CHAMP / C1 NRLMSIS_quiet C1 NRLMSIS/ C1 NRLMSIS_quiet MgII proxy: The composite MgII index (Viereck et al, 2004) is used as a proxy for solar EUV instead of F10.7
NRLMSIS_quiet is used as a reference,that accounts for LT, seasonal variations, solar activity…
- Analysis of the height larger events • Statistical analysis: binning of normalized C1 coefficients as a function of ap
Day time Night time Density perturbation ap index ap index correlation coefficient between CHAMP data and ap x : CHAMP data x : NRLMSIS model Binning is done using the value of ap from the previous 3 hour interval
x Day time + Night time
x Day time + Night time Linear fit y =1.9 x – 0.9
x Day time + Night time Day and Night time with ap <100
x Day time + Night time Day and Night with ap <100 Quadratic fit y =1.92 x2 – 3 x + 2.14
3 days Density perturbation: CHAMP data and NRLMSIS model Day time Night time Day of 2004 ap magnetic index - the relative density increase is greatly underestimated by the model - the model seems to correctly represent the shape of the perturbation
3 days The perturbations appear later in the data than in the model and this timing discrepancy is slightly larger during night ( 3-4.5 hours) than during day time. Density perturbation: CHAMP data and NRLMSIS model normalized to the amplitude of the data perturbation Normalization factor mean value = 2.3
Conclusion Altitudes about 400km. Latitudes between 50S and 50N • NRLMSISE-00 correctly estimates the main features of the thermosphere density response to geomagnetic activity: - the morphology of UT variations - the larger relative increase during night than during day time But it underestimates : • the amplitude of the density response (by about a factor 2) • and its phase lag (up to 4.5 hours)