Download

1 / 17
170 likes | 300 Views
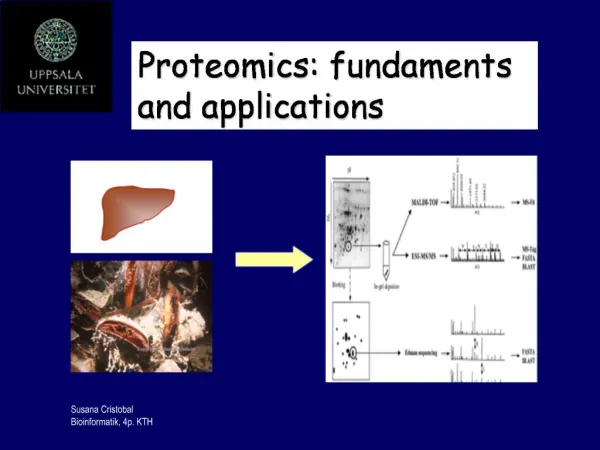
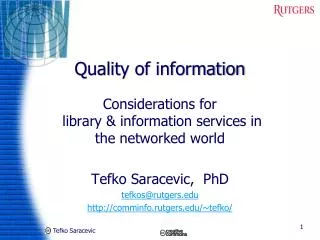
Towards the Management of Information Quality in Proteomics. David Stead University of Aberdeen. What is Proteomics?. The large-scale study of proteins of an organism, cell or tissue. Colony morphologies of Candida albicans wild-type and nrg1 mutant.

E N D
Towards the Management of Information Quality in Proteomics David Stead University of Aberdeen
What is Proteomics? The large-scale study of proteins of an organism, cell or tissue Colony morphologies of Candida albicans wild-type and nrg1 mutant Electron micrograph of a breast cancer cell (picture courtesy of the National Cancer Institute) MALDI protein imaging of a human glioblastoma slice (Stoeckli et al. Nature Medicine7, 493)
pI 4 7 100 Mr (kDa) 10 “Classical” proteomics Separation (2-Dimensional gel electrophoresis) Quantification (Intensity of staining of protein spot) Normalised spot volume Identification (Peptide mass fingerprinting) Biological function
Should we be concernedabout information qualityin proteomics? • More, larger, datasets being generated • Combine datasets from different labs • Answer new biological or technical questions • Quality of information may affect decisions on how the data is used …a significant but undefined number of the proteins being reported as “identified” in proteomics articles are likely to be false positives. Steven Carr et al. (2004) Molecular & Cellular Proteomics3, 531
Assessing the qualityof protein identifications Difficulties: • Expert scrutiny of original MS data is not practical for large datasets • No established minimum acceptance criteria for protein identifications by MS Hypothesis: Any peptide mass fingerprinting search report contains information that enables a universal quality score to be calculated
R K H2N R >Candida albicans|CA0001|IPF19501 unknown function MYQTDHGVHNVDGRMSRYIIIPDRSTIRPLLTSNLIAGSLLPSLHCSVSLFLDRVRSSLSSVSVPARVSLPRCFWLSKCLSLGARVRSLFPSLSLSRSYSSSSGPALLYSSVVHSPFLFLLLHSSLFRLLSSPLSSCSLQHLLILNSQWTHRRWEGATQFSSVKGISAVFRPSRASMCPRGFFXCSVCVPLSFRVSIGPFMLFRVPIGFSCISGPLAICFPFNEFLSCLPFLLFRFLFHPLQFLSGLPLLHYSPVINPRPFGFPHPAQPSSYV K COOH KP H2N K R R KP K COOH Protein identification by peptide mass fingerprinting Protein Protein sequence database tryptic digestion in silico digestion 783.3858 889.5141 1089.5898 1089.6163 1106.6204 1166.6390 1239.6004 1628.7234 2733.4504 3223.7871 3398.7783 MALDI-TOF Theoretical mass lists Experimental mass list Search engine
Protein identification quality indicators Hit ratio (HR) –the number of masses matched divided by the number of masses submitted to the search • Provides a measure of the signal-to-noise ratio in the mass spectrum peptide mass fingerprint highlighted peaks matched to protein mass list m1 m2 m3 m4 m5 m6 m7 m8 m9 m10 m4 m4 m8 m8 database searching spectrum processing m7 m7 m5 m5 m9 m9 m1 m1 m3 m10 m3 m10 m2 m6 m2 m6 m/z m/z HR = 6/10 = 0.6
Protein identification quality indicators Mass coverage (MC) – the percent sequence coverage multiplied by the protein mass in kDa MC = 55752 x 25 1000 100 = 13.9 kDa – Measures the amount of protein sequence matched
Protein identification quality indicators Excess of limit-digested peptides (ELDP) – the number of matched peptides having no missed cleavages minus the number of matched peptides containing a missed cleavage site • reflects the completeness of the digestion that precedes the peptide mass fingerprinting ELDP = 5 – 3 = +2
Protein identification quality indicators • David A. Stead, Alun Preece, and Alistair J. P. Brown • Universal metrics for quality assessment of protein identifications by mass spectrometryMCP published March 27, 2006 www.mcponline.org/cgi/reprint/M500426-MCP200v1 Clostridium difficile Streptomyces coelicolor Methanococcus jannaschii
ROC analysis shows that HR, MC, and ELDP can discriminate between correct and incorrect protein identifications PMF score = (100 * HR) + MC + (10 * ELDP) Data from 581 PMF experiments (protein identifications from 2-D gel spots)
Qurator provides an information quality (IQ) framework • Extend generic ontology of IQ concepts • Allow scientists to define quality characteristics specific to their domain • HR, MC, ELDP • Framework for managing IQ • Allow scientists to use their own IQ definitions • ... and reuse those created by others • Annotate experimental data with quality characteristics • Produce “quality-aware” information resources • Allow user-scientists to access/select/filter data according to their quality preferences www.qurator.org
Making the Qurator framework useful • A key aim of the Qurator project is to integrate IQ tools with existing standards • IQ indicators should apply to common data formats • Qurator functions should be plugged into tools already used by scientists • For proteomics we have aligned Qurator with • the PEDRo standard data model (and its XML serialisation) • the Pedro data entry tool sourceforge.net/projects/pedro
PEDRo: a standard formatfor proteomics data Section of XML output from PEDRo data collator tool Taylor CF et al. (2003) Nature Biotechnology3, 247 PEDRo schema
Qurator Pedro Plugin Values for the calculated indicators for the selected data items are displayed along with basic provenance data (e.g. timestamp…) Web services that calculate the IQ indicators can be invoked using the “Plugins” button When a data model is selected, the Qurator Pedro plugin queries the IQ ontology to discover indicators relevant to the kind of data e.g. for the PEDRo proteomics model, HR, MC and ELDP
Conclusions & future work • Numerical indicators (HR, MC, and ELDP) that describe the quality of protein identifications by peptide mass fingerprinting • Useful for validation of protein identifications • Can be computed from search reports (e.g. Mascot) • The proteomics case is a proof-of-concept for the Qurator IQ framework • We are working to embed Qurator services in a wider range of desktop tools (e.g. Taverna workflow environment) • Further usability/usefulness trials of the tools are planned
Acknowledgements Alun Preece Binling Jin Al Brown Paulo Missier Suzanne Embury Computing Science Medical Sciences Computer Science www.qurator.org www.abdn.ac.uk/proteomics