Download
1 / 24
240 likes | 362 Views
General Regional Impacts To California specifics. WG2 SPM. IPCC, 2007 – North America. “ "Warming in western mountains is projected to cause decreased snowpack, more winter flooding, and reduced summer flows, exacerbating competition for over-allocated water resources”. IPCC, FAR 2007

E N D
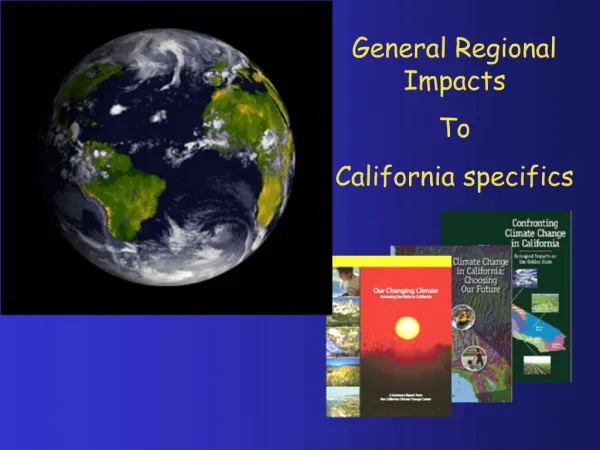
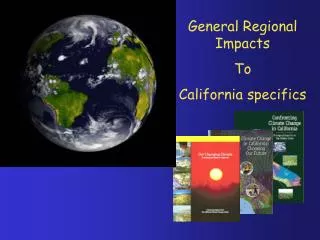
General Regional Impacts To California specifics WG2 SPM
IPCC, 2007 – North America “"Warming in western mountains is projected to cause decreased snowpack, more winter flooding, and reduced summer flows, exacerbating competition for over-allocated water resources” IPCC, FAR 2007 North America section
Will California receive adequate precipitation? Little consensus wetter or drier Cayan et al. 2006
Decreasing Snowpack Increasing Warming CA Climate Change Center Summary Report (2006)
“Disturbances from pests, diseases, and fire are projected to have increasing impacts on forests, with an extended period of high fire risk and large increases in area burned.” IPCC, FAR 2007 North America section
Climate change impacts on forests • Increased Temperatures • (effects Productivity) • CO2 fertilization • (effects Productivity) • Longer Dry Season • Increased vulnerability to: • Widlfires • Pests • Direct mortality • Shifts in species distribution Slide modified from Climate Impacts group, Washington www.cses.washington.edu
Wildfires Frequency increased four fold in last 30 years. Western US area burned Source: Westerling et Al. 2006
Increasing Wildfire Frequency Increasing Warming CA Climate Change Center Summary Report (2006)
“Coastal communities and habitats will be increasingly stressed by climate change impacts interacting with development and pollution...” IPCC, FAR 2007 North America section
15 10 5 0 -5 -10 -15 Coastal structure must account for rising seas Mean Sea Level Relative to 1990 (inches) SF Bay sea level risen ~ 7 Inches over last century 1900 2000 1925 1975 1950 http://ncpa.com/generation-plants/2.html Year
“Cities that currently experience heat waves are expected to be further challenged by an increased number, intensity and duration of heat waves during the course of the century, with potential for adverse health impacts..” IPCC, FAR 2007 North America section
4-6 times as many heat-related mortality 3-4 times as many heat wave days Higher Warming Range (8-10.5 °F) 2.5-4 times as many heat-related mortality 2-4 times as many heat wave days Medium Warming Range (5.5-8 °F) Lower Warming Range (3-5.5 °F) 2-3 times as many heat-related mortality 2-2.5 times as many heat wave days 5 4 California Heat waves Summer 2006 in California --~ 160 deaths - greater than 25,000 cattle dead - impact on agricultural crops - impacts on energy supply and demand Projections Sources: “Midwest suffers as heat bears down” Carla Johnson, Associated Press, appearing in Houston Chronicle, July 31, 2006 (July 21 total + 163). “California's Cattle Death Toll Surpases 25,000” USAgNet, July 31, 2006.. California Climate Change Center 2006
California Climate ChangeScenarios ReportProduced by California Climate Change Center in collaboration with UCS • Eighteen papers have been released involving researchers from: • Scripps Institution of Oceanography, UC Berkeley, • UC Davis, • Santa Clara University, • LBNL, LLNL, • US Forest Service, • Oregon State University, • Union of Concerned Scientists • State Agencies: ARB, DWR, and CEC. www.climatechoices.org, www.energy.ca.gov, Or www.climatechange.ca.gov
Slide from California Air Resources Board presentation January 22, 2007
AB 32—California Global Warming Solutions Act (2006) • Economy-wide GHG emission reduction to 1990 levels by 2020 (about a 30%) • California Air Resources Board—lead agency. California EPA and Climate Action Team will oversee multi-agency coordination. • Legislature may also play role through budget process or through legislation to require certain regulations
AB 32 Implementation Slide from California Air Resources Board presentation January 22, 2007
Communicating With the Media • Write a letter-to-the-editor (respond to stories out today) • Monitor local news for climate contrarians and respond with letter-to-the-editor • Make a call today to your newspaper’s environmental reporter and offer to help with background information or make a statement. • Meet with an editorial board of your local paper
Tips for Interviews • Remember your audience • Before talking to a reporter, develop some main messages and talking points • Keep it simple • Frame it in human terms
Materials & Resources on UCS Website: • IPCC Process Backgrounder, IPCC Flyer • UCS brochure on key findings of WGI. WGII brochure available for download in a week • UCS ppt presentation on key findings of WGI. WGII ppt slides available for download in about a week. • SSI members will get an email notifying you when the WGII materials are available
IPCC Process www.ucsusa.org/global_warming/science/the-ipcc.html UCS IPCC Synthesis Materials (SSI password-protected site) www.ucsusa.org/ssi/ipcc Tips on media and talking to policy makers www.ucsusa.org/ssi California Climate Impacts www.climatechoices.org For questions, to receive materials, and tell us what you are doing to amplify coverage of climate issues in California, email ssi@ucsusa.org
WATER • Many rivers that derive water at their source from melting glaciers or snow will have earlier peak runoff in Spring and an overall increase in run-off, at least in the short term.** • The temporary increase in water flows will not always be welcome. For example, glacier melt in the Himalayas will increase flooding and rock avalanche risks, while flash flood risks will increase in inland areas in Europe.***
Temperatures are Relative to Today • Global average temperature increase in these slides is expressed as temperature rise above today. • Add 0.8 degrees Celsius to convert these to temperature rise above pre-industrial (about 1750) levels. • The numbers and figures in the summary for policymakers uses temperature rise above 1990 levels which is 0.6 degrees Celsius above pre-industrial levels.
Thank you! Questions
Links for US regional impacts: • Northeast: http://www.climatechoices.org/ne/index.html • Great Lakes: http://www.ucsusa.org/greatlakes/ • California: http://www.climatechoices.org/ca/index.html • Gulf coast: http://www.ucsusa.org/gulf/ • Iowa: http://www.ucsusa.org/global_warming/science/climate-change-in-the-hawkeye-state.html. • Alaska: http://www.ucsusa.org/global_warming/science/arctic-climate-impact-assessment.html.