Download
1 / 1
10 likes | 96 Views
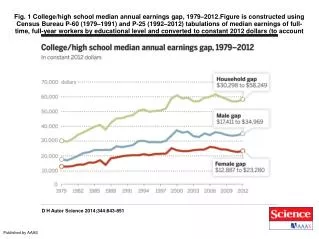
This figure illustrates the median annual earnings gap over three decades, comparing college and high school graduates. The data is adjusted for inflation to 2012 dollars. Published by Science in 2014.

E N D
Fig. 1 College/high school median annual earnings gap, 1979–2012.Figure is constructed using Census Bureau P-60 (1979–1991) and P-25 (1992–2012) tabulations of median earnings of full-time, full-year workers by educational level and converted to constant 2012 dollars (to account for inflation) using the CPI-U-RS price series. D H Autor Science 2014;344:843-851 Published by AAAS