Download
1 / 27
270 likes | 289 Views
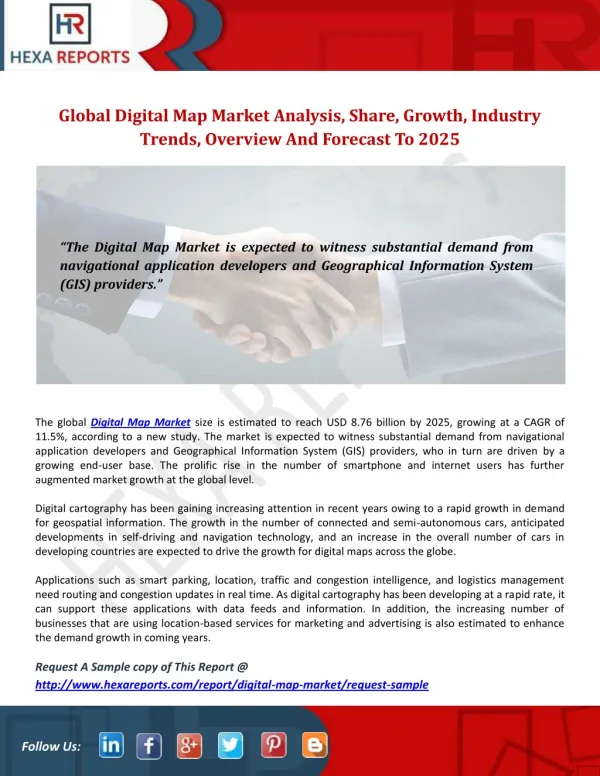
The global digital map market grew at a CAGR of around 15% during 2014-2019. Looking forward, IMARC Group expects the global digital map market to continue its strong growth during the next five years.<br><br>To learn more about this market, visit us at: https://www.imarcgroup.com/digital-map-market<br><br>We are regularly tracking the direct effect of COVID-19 on the market, along with the indirect influence of associated industries. These observations will be integrated into the report.<br><br>Rapid urbanization and the increasing adoption of mobile computing devices for navigation are among the key factors driving the growth of the market. There is a rising demand for 3D platforms and advanced technologies that use visualization, simulations and dynamic location-based inputs.<br><br>For more information, request for a free sample report here: https://www.imarcgroup.com/digital-map-market/requestsample<br> Contact Us:<br><br>IMARC Group<br>30 N Gould St, Ste R<br>Sheridan, WY (Wyoming) 82801 USA<br>Email: Sales@imarcgroup.com<br>Tel No:(D) 91 120 433 0800<br>Americas:- 1 631 791 1145 | Africa and Europe :- 44-702-409-7331 | Asia: 91-120-433-0800, 91-120-433-0800

E N D
Global Digital Map Market Research Report and Forecast 2025 www.imarcgroup.com Sales@imarcgroup.com +1-631-791-1145
About IMARC WHO WE ARE? • We are a leading market research firm with expertise in market intelligence and business research • We deliver high quality, well- knitted, meaningful studies • We excel at understanding and synergizing with the business priorities of our partners and delivering tailored solutions WHAT DO WE DO? • Market research and business insights • Competitive intelligence and benchmarking • Strategy consulting • Consumer surveys and feedback analysis • Social and rural research • Market entry strategy • Syndicated Reports WHAT DO WE COVER? • Food And beverages • Dairy and dairy products • Agriculture and farming • Chemicals and materials • FMCG • Paper and packaging • Healthcare • Machinery, electronics and semiconductors WHO DO WE SERVE? • Collaborating with fortune 500 companies and SMEs • Serving all major clients from different industry which include Chemical & Materials, Food & Beverages, Packaging, Healthcare, Automotive, Heavy Industries, Retail, etc.
What We Do Competitive Intelligence and Benchmarking At IMARC, we help customers determine a competitor’s brand image and perception in the marketplace as compared to other key players. Cost Modeling and Cost Forecasting A good cost model supports organizations during negotiations to build strong relationships with suppliers. Cost modelling and price forecasting services from IMARC ensure clients make informed decisions. Market Research & Business Insights To develop deep customer understanding, we employ a range of quantitative and qualitative marketing research approaches along with big data techniques that are both innovative and pragmatic Country Entry Strategy IMARC team drafts and implement an optimum country entry strategy for expanding business in the country. Our team of consultants deeply evaluates and strategize the market opportunities for our clients and accentuate the business in congruence with Government regulations, exports and imports scenario, demand supply gap analysis and many more. Consumer Survey & Feedback Reports Consumer profiling, survey with end consumers, collection of their feedback and deep analysis. Based on the analysis, strategic decisions to enter in a new region, launch of new product, improvising the existing services Consumer Survey & Feedback Reports Competitive Intelligence and Benchmarking Cost Modeling and Cost Forecasting Market Research & Business Insights Country Entry Strategy
REPORT OBJECTIVES & Highlight
Report Description The global digital map market grew at a CAGR of around 15% during 2014-2019. A digital map refers to a web-based software solution that is used to represent a specific road, area or geographical location. It is virtually created by collecting data and formatting it into an image through digital formatting that is presented on a digital interface. It consists of various graphical elements that are combined to provide information of waterbodies, roads and important landmarks in a given area. It is also used for calculating distances between different places. Digital maps offer various benefits, such as scalability, accuracy, real-time information, interaction and compact systems to operate. Owing to this, they find extensive applications in smart parking, location, traffic and congestion intelligence, navigation and logistics management. Get a PDF Sample for more detailed market insights: https://www.imarcgroup.com/digital-map-market/requestsample Market Trends: Digital maps are increasingly being utilized in the construction and engineering sectors to help construction engineers implement adequate safety measures in buildings and visualize territorial data for efficient infrastructural planning. Besides this, the rapid adoption of 3D platforms for surveying and digital mapmaking is contributing to the market. These 3D maps are made using high-quality geographic data, which helps create 3D visualizations, run simulations, and develop dynamic location-based experiences and games to enhance the customer experience. Apart from this, with the rising penetration of smartphones and other portable devices, users are relying more on mapping applications such as Google Maps and City mapper for locations and directions or searching restaurants, banks, ATMs, or gas stations. This has escalated the demand for digital maps across the globe. Moreover, the leading companies are offering traffic updates, roadblocks, updated places of interest, landmarks, and others in their maps, which makes them more user-friendly. Looking forward, the market is expected to witness strong growth during the forecast period (2020-2025).
Report Description Digital Map Market 2020-2025: Segmentation and Analysis of Top Key players Breakup by Type: • • • • • GIS LiDAR Digital Orthophotography Aerial Photography Others Breakup by Usage: • • Indoor Outdoor Breakup by Solution: • • Software Services Breakup by Deployment Mode: • • Cloud-based On-premise
Report Description Breakup by Application: • • • • • Real-Time Location Data Management Geocoding and Geopositioning Routing and Navigation Asset Tracking Others Breakup by End-Use Industry: • • • • • • Automotive Engineering and Construction Logistics and Transportation Energy and Utilities Military, Aerospace and Defense Others Explore full report with table of contents: https://www.imarcgroup.com/digital-map-market
Report Description Breakup by Region: North America United States Canada Asia Pacific China Japan India South Korea Australia Indonesia Others Europe Germany France United Kingdom Italy Spain Russia Others Latin America Brazil Mexico Others Middle East and Africa • o o • o o o o o o o • o o o o o o o • o o o •
Report Description Key Questions Answered in This Report: • • • • • • • • • • • • • How has the global digital map market performed so far and how will it perform in the coming years? What are the key regional markets? What has been the impact of COVID-19 on the global digital map market? What is the breakup of the market based on the type? What is the breakup of the market based on the usage? What is the breakup of the market based on the solution? What is the breakup of the market based on the deployment mode? What is the breakup of the market based on the application? What is the breakup of the market based on the end-use industry? What are the various stages in the value chain of the industry? What are the key driving factors and challenges in the industry? What is the structure of the global digital map market and who are the key players? What is the degree of competition in the industry? Browse Related Report: https://www.imarcgroup.com/data-center-colocation-market https://www.imarcgroup.com/data-acquisition-system-market
Table of Contents 1 Preface 2 Scope and Methodology 2.1 Objectives of the Study 2.2 Stakeholders 2.3 Data Sources 2.3.1 Primary Sources 2.3.2 Secondary Sources 2.4 Market Estimation 2.4.1 Bottom-Up Approach 2.4.2 Top-Down Approach 2.5 Forecasting Methodology 3 Executive Summary 4 Introduction 4.1 Overview 4.2 Key Industry Trends 5 Global Digital Map Market 5.1 Market Overview 5.2 Market Performance 5.3 Impact of COVID-19 5.4 Market Forecast 6 Market Breakup by Type 6.1 GIS 6.1.1 Market Trends 6.1.2 Market Forecast 6.2 LiDAR 6.2.1 Market Trends 6.2.2 Market Forecast
Table of Contents 6.3 Digital Orthophotography 6.3.1 Market Trends 6.3.2 Market Forecast 6.4 Aerial Photography 6.4.1 Market Trends 6.4.2 Market Forecast 6.5 Others 6.5.1 Market Trends 6.5.2 Market Forecast 7 Market Breakup by Usage 7.1 Indoor 7.1.1 Market Trends 7.1.2 Market Forecast 7.2 Outdoor 7.2.1 Market Trends 7.2.2 Market Forecast 8 Market Breakup by Solution 8.1 Software 8.1.1 Market Trends 8.1.2 Market Forecast 8.2 Services 8.2.1 Market Trends 8.2.2 Market Forecast 9 Market Breakup by Deployment Mode 9.1 Cloud-based 9.1.1 Market Trends 9.1.2 Market Forecast
Table of Contents 9.2 On-premise 9.2.1 Market Trends 9.2.2 Market Forecast 10 Market Breakup by Application 10.1 Real-Time Location Data Management 10.1.1 Market Trends 10.1.2 Market Forecast 10.2 Geocoding and Geopositioning 10.2.1 Market Trends 10.2.2 Market Forecast 10.3 Routing and Navigation 10.3.1 Market Trends 10.3.2 Market Forecast 10.4 Asset Tracking 10.4.1 Market Trends 10.4.2 Market Forecast 10.5 Others 10.5.1 Market Trends 10.5.2 Market Forecast 11 Market Breakup by End-Use Industry 11.1 Automotive 11.1.1 Market Trends 11.1.2 Market Forecast 11.2 Engineering and Construction 11.2.1 Market Trends 11.2.2 Market Forecast 11.3 Logistics and Transportation 11.3.1 Market Trends 11.3.2 Market Forecast
Table of Contents 11.4 Energy and Utilities 11.4.1 Market Trends 11.4.2 Market Forecast 11.5 Military, Aerospace and Defense 11.5.1 Market Trends 11.5.2 Market Forecast 11.6 Others 11.6.1 Market Trends 11.6.2 Market Forecast 12 Market Breakup by Region 12.1 North America 12.1.1 United States 12.1.1.1 Market Trends 12.1.1.2 Market Forecast 12.1.2 Canada 12.1.2.1 Market Trends 12.1.2.2 Market Forecast 12.2 Asia Pacific 12.2.1 China 12.2.1.1 Market Trends 12.2.1.2 Market Forecast 12.2.2 Japan 12.2.2.1 Market Trends 12.2.2.2 Market Forecast 12.2.3 India 12.2.3.1 Market Trends 12.2.3.2 Market Forecast
Table of Contents 12.2.4 South Korea 12.2.4.1 Market Trends 12.2.4.2 Market Forecast 12.2.5 Australia 12.2.5.1 Market Trends 12.2.5.2 Market Forecast 12.2.6 Indonesia 12.2.6.1 Market Trends 12.2.6.2 Market Forecast 12.2.7 Others 12.2.7.1 Market Trends 12.2.7.2 Market Forecast 12.3 Europe 12.3.1 Germany 12.3.1.1 Market Trends 12.3.1.2 Market Forecast 12.3.2 France 12.3.2.1 Market Trends 12.3.2.2 Market Forecast 12.3.3 United Kingdom 12.3.3.1 Market Trends 12.3.3.2 Market Forecast 12.3.4 Italy 12.3.4.1 Market Trends 12.3.4.2 Market Forecast
Table of Contents 12.3.4.1 Market Trends 12.3.4.2 Market Forecast 12.3.5 Spain 12.3.5.1 Market Trends 12.3.5.2 Market Forecast 12.3.6 Russia 12.3.6.1 Market Trends 12.3.6.2 Market Forecast 12.3.7 Others 12.3.7.1 Market Trends 12.3.7.2 Market Forecast 12.4 Latin America 12.4.1 Brazil 12.4.1.1 Market Trends 12.4.1.2 Market Forecast 12.4.2 Mexico 12.4.2.1 Market Trends 12.4.2.2 Market Forecast 12.4.3 Others 12.4.3.1 Market Trends 12.4.3.2 Market Forecast 12.5 Middle East and Africa 12.5.1 Market Trends 12.5.2 Market Breakup by Country 12.5.3 Market Forecast
Table of Contents 13 SWOT Analysis 13.1 Overview 13.2 Strengths 13.3 Weaknesses 13.4 Opportunities 13.5 Threats 14 Value Chain Analysis 15 Porters Five Forces Analysis 15.1 Overview 15.2 Bargaining Power of Buyers 15.3 Bargaining Power of Suppliers 15.4 Degree of Competition 15.5 Threat of New Entrants 15.6 Threat of Substitutes 16 Competitive Landscape 16.1 Market Structure 16.2 Key Players 16.3 Profiles of Key Players 16.3.1 Apple Inc. 16.3.1.1 Company Overview 16.3.1.2 Product Portfolio 16.3.1.3 Financials 16.3.1.4 SWOT Analysis 16.3.2 Collins Bartholomew 16.3.2.1 Company Overview 16.3.2.2 Product Portfolio
Table of Contents 16.3.3 Digital Map Products Inc. (LightBox) 16.3.3.1 Company Overview 16.3.3.2 Product Portfolio 16.3.4 Environmental Systems Research Institute Inc. 16.3.4.1 Company Overview 16.3.4.2 Product Portfolio 16.3.4.3 SWOT Analysis 16.3.5 Getmapping 16.3.5.1 Company Overview 16.3.5.2 Product Portfolio 16.3.5.3 Financials 16.3.6 Google LLC (Alphabet Inc.) 16.3.6.1 Company Overview 16.3.6.2 Product Portfolio 16.3.6.3 SWOT Analysis 16.3.7 HERE Technologies 16.3.7.1 Company Overview 16.3.7.2 Product Portfolio 16.3.8 MAPQUEST INC. (America Online) 16.3.8.1 Company Overview 16.3.8.2 Product Portfolio 16.3.9 Maxar Technologies 16.3.9.1 Company Overview 16.3.9.2 Product Portfolio 16.3.9.3 Financials
Table of Contents 16.3.10 Nearmap 16.3.10.1 Company Overview 16.3.10.2 Product Portfolio 16.3.10.3 Financials 16.3.11 ThinkGeo LLC 16.3.11.1 Company Overview 16.3.11.2 Product Portfolio 16.3.12 TomTom International B.V. 16.3.12.1 Company Overview 16.3.12.2 Product Portfolio
Report FAQs Team Profile Team Profile
Team Profile Growing team of 150+ employees with deep market knowledge Engineers and Post Graduates Account for 75% of our Team Post Graduates 30% Over 1000 Independent Consultants from different sectors Engineers 45% Talents from some of the top universities modelling specialists with unmatched expertise in quantitative research Individuals with experience in specific industries and having sound knowledge of targeted functional areas Non Engineering Graduates 15% Commercial and non-commercial relationships with some of the top research institutes Others 10%
Report FAQs Words From Client
Words From Client “We have been working with IMARC Group for over two years now. I must say that the word impossible doesn’t seems to appear in their dictionary,. These guys can provide data for any market in any country. I have been given them challenging assignments to work upon and have been quite impressed with their approach and results.” Procurement Technology Manager – Global FMCG Giant -Global “IMARC Group has great domain expertise and knowledge base provided all the inputs necessary for us to define the path forward and launch our diagnostic successfully in the market where other players were always afraid before investing.” -Vice President Marketing – European Diagnostic Company “We were really impressed with their research findings on the South India dairy market. The innovative idea suggested by them have given us altogether different aspect to look at the problem. We started with them on small project but now thinking on doing more strategic project with them.” -National Manager (Marketing) – Indian Diary Giant “IMARC Group helped us with the outsourcing of a major part of clinical trials to India. In the beginning we were skeptic of this idea. But the success achieved from this strategy is driving us to outsource other verticals of our business to low cost destinations” - Member of Board of Managing Director – Global Pharmaceutical Giant “Working with IMARC Group has been a great experience. They were able to provide us with a comprehensive business report on the India wastewater treatment market. The finding from the reports are played a major role in our business strategies and future decision making” -Senior Vice President – Major Indian Effluent Treatment Company
Report FAQs Report FAQs
Report FAQs 01 02 03 Do you provide market share information for a specific country/segment? Yes, we provide market share information and insights considering the scope. This service is provided as a part of customization requirements. My research requirement is very specific; can I customized the report? Yes, we provide customization of reports based on your requirements. It will be charged based on the scope of customization. Client have free access to pre-sales analyst briefs to discuss requirement and recommendations. How do you arrive at the market numbers? Our research methodology is a three cyclic process. It starts from information procurement from our inhouse database, primary research and secondary sources. The second step is data collection and analysis. The third step is data validation from industry experts, key players and other stakeholders. 04 05 I have a pre-defined budget. Can I buy chapters/sections of the report? We generally do not promote the sale of separate or individual segments from within a study, as it might fail to relay the actual meaning of the study or provide a holistic picture of the market. However, in special cases, select chapters are provided based on the client requirement. Do you offer post sales support? Yes, we offer post purchase analyst support for 4-6 weeks to our client in case they have any query within the scope of study.
Report FAQs 06 07 Who are your client? We have engaged 550+ clients across the globe. More than half of our client are re-engage us for additional reports and services How will I receive the report? The report in a PDF and Excel format will be sent to you electronically at your registered email address. Moreover, PPT and Word formats are also delivered to clients, on special requests. 08 09 How often does IMARC update studies? Research studies or reports are updated once in 6 months or a year depending on the traction & need. Please contact our sales team to inquire about a report update status. Will I have to pay for the post-sale customization needs? We offer our clients with a free 10% customization on the syndicated report. In case you have not availed this service as a pre-sale facility, we request you to share the requirements with our sales team. The research team post a feasibility will share the purview of the post-sale customization along with the price (if applicable) and the timeline.