Download
1 / 20
210 likes | 419 Views
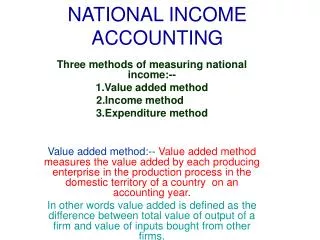
ANALYSIS OF NATIONAL INCOME. PRODUCTION INCOME EXPENDITURE.

E N D
PRODUCTION INCOME EXPENDITURE
Value Added Method Measures The Value Added (Contribution) By Each Producing Enterprises In TheProduction Process In The Domestic Territory Of A Country In An Accounting Year. In A Simple Meaning(Value Added Is Defined As The Difference Between Total Value Of Output Of A Firm And Value Of Inputs Bought From Other Firm) VALUE ADDED METHOD
SYMBOLICALLY :-Net value added at FC = Gross output - intermediate consumption (NVAfc) -depreciation-net indirect taxes value of output = sales + change in stock ( it is always at MP) ^i.e. gross output Value added = value of output - value of intermediate goods = gross product = gross value added at MP NVA at MP = GVA at MP –depreciation NVA at FC = NVA at MP – net indirect taxes
THE INCOME METHOD:The Income method measures national income from the side of payments made to the primary factors of production in the form of rent, wages , interest and profit for their productive services in an accounting year . Thus if factor incomes generated by all the producing units located within the domestic economy during a period of account are added up to, the resulting total will be Domestic income or Net Domestic Product at FC (NDP at FC)
a) Domestic income = rent + wages + interest + mixed income +profit tax + dividend + undistributed profit + surplus of govt. sector (if shown separately) or = Compensation of employees + operating surplus + mixed income
b)National income = Domestic income + net factor income from abroad1) Private income = National income - surplus of government sectional types of transfer income including national debt interest.2)Personal income = National income - surplus of goverment sector -corporate tax - undistributed profit + all types of transfer income including national debt interest.3) Personal income = Private income - corporate tax - undistributed profit..
4) Personal Disposable income = personal income - personal taxes (including miscellaneous receipt of the government). 5) Personal Disposable income = private income-corporate tax-undistributed profit - personal taxes6) Personal Disposable income = National income -surplus of govt. sector - corporate tax -undistributed profit + all types of transfer come -personal taxes7) Private income = Income from domestic product accruing to private sector + net factor income from abroad + all types of transfer income including national debt interest
EXPENDITURE METHOD :- Expenditure method measures final expenditure on Gross Domestic Product at market price (GDP at MP) during a period of account .By adding up all the items of final consumption expenditure and final investment expenditure within the domestic economy, we get the aggregate called GDP at mp.i.e. why expenditure method is also knows as' Consumption and investment method' or' income Disposable method'.
MEASURES GDP by expenditure method GDPmp = private final consumption expenditure+ final investment expenditure ( government final consumption expenditure+ gross fixed capital formation+change in stock+net export).GDP = C+I+G+(X-M)
AGGREGATE DEMAND ;-Aggregate demand broadly refers to the total demand for goods and services in the economy. aggregate demand is also defined as " the total amount of money which all Sections ( households, firms,government) are ready to spend on purchase of goods services produced in an economy during a given period ”." Aggregate demand is the total expenditure on consumption and investment “AD = C+IAGGREGATE SUPPLY;- Aggregate supply is the value of total output available for purchase by the economy during a given period, sum of the factor incomes (rent, wages, interest & profit) at national level is called NATIONAL INCOME. A major portion of income is spent on consumption of goods and services and the balanced is saved; AS = C+S
consumption function:- meaning - The relationship between consumption and income is called consumption function [ or propensity to consume ].we may bifurcate consumption in two parts; (i) first part relates to consumption when income is zero i.e. when minimum level of consumption has to be maintained for survival. this is called autonomous consumption [denoted by c] (ii) second part of consumption is when income increases,consumption also increases but by a lesser amount i.e.additional consumption (c) is less than additional income (y).this may be represented,by b(i.e.,marginal propensity to consume).thus consumption function may be represented in the following equation. c = c + by
measured APC and MPCAVERAGE PROPENSITY TO CONSUME ( APC)The ratio of total consumption expenditure to total income is called APC. APC = C/YWHEREC = CONSUMPTION EXPENDITURE AND Y = TOTAL INCOME{ The value of APC may be greater than 1 when at very lowlevel of income , consumption exceeds income to meet the very basic necessities(then saving becomes negatives).}
MARGINAL PROPENSITY TO CONSUME (MPC) The ratio of change in consumption(c) to change in income (Y) is called marginal propensity to consume. literally marginal means additional (or incremental) and propensity to consume means desire ( or urge) to consume. thus MPC is the ratio of additional consumption to additional income. it indicates the proportion of additional income that is being spent on additional consumption. MPC =C/Y Hence, MPC is always greater than zero (MPC > 0)and less than 1(MPC < 1)because additional consumption (c) is less than additional income (y). thus value of MPC lies between 0 and 1 }
Circular Flow ofMacro Economic Activity National income accounting calls for an understanding of the structure of the macro economy. A pictorial illustration of this inter-independence between the major sectors of economic activity is called the circular flow of income and product. The circular flow of income involves two basic principles: a) In any exchange process, the seller or producer receive the same amount that the buyer or consumer spends; and b) Goods and services flow in one direction and money payments to acquire these, flow in the return direction, thereby causing a cicular flow. So, the output or product or real flow from the seller to the buyer necessarily creates the income or payment or money flow from the buyer to the seller.
There are two types of market First, market for goods and services – Product market; and second, market for factors of production – Factor market. Circular flow of income can be depicted in two-sector, three-sector and four-sector models.
PRODUCT MARKET Money value of final goods and servies Final consumer goods and services Savings Financial System Savings Firms Households Borrowings Borrowings Factor Services Factor Payments FACTOR MARKET