Download
1 / 5
50 likes | 215 Views
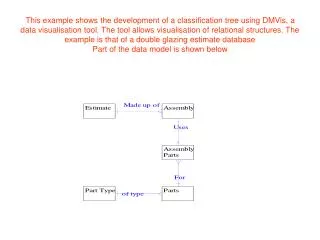
This example shows the development of a classification tree using DMVis, a data visualisation tool. The tool allows visualisation of relational structures. The example is that of a double glazing estimate database Part of the data model is shown below. Data Base. Cluster A. Cluster D.

E N D
This example shows the development of a classification tree using DMVis, a data visualisation tool. The tool allows visualisation of relational structures. The example is that of a double glazing estimate database Part of the data model is shown below
Data Base Cluster A Cluster D Cluster E Cluster B Cluster C Visualisation of the whole database of estimatesIt shows 5 (or 6?) clear groups
Tool selects Cluster A to visualise separately Data Base A B C D E
Visualisation of cluster A shows that it has 4 clear sub clusters Data Base A B C D E A1 A2 A3 A4
Classification by visualisation • The tree produced by use of the visualisation tool showed advantages over other clustering techniques: • The resulting classification had a natural hierarchy. The hierarchy had an easily understood basis for human understanding. • Problems as to degree of branching ( at the first level, 4 at the second for cluster A ) are easily resolved visually. Long thin trees, such as are produced by a with binary division system, or short fat trees, with too many classes are un-natural, and hard to understand. They frequently need re-structuring. • The visualisation method can be applied to relational and recursive database structures, and doesn’t require a single table or query to be identified.