Download
1 / 18
190 likes | 408 Views
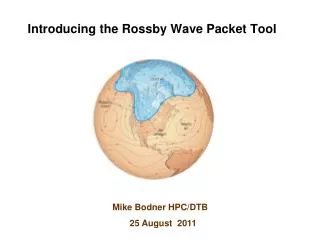
A Climatology and Model Validation of Rossby Wave Packets. Brian Colle, Matthew Souders, and Edmund Chang Stony Brook University School of Marine and Atmospheric Sciences. Rossby Wave Packet Background.

E N D
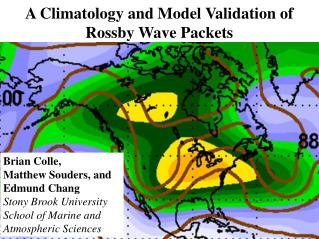
A Climatology and Model Validation of Rossby Wave Packets Brian Colle, Matthew Souders, and Edmund Chang Stony Brook University School of Marine and Atmospheric Sciences
Rossby Wave Packet Background Hovmoller Diagram: 300 hPa Meridional Wind (left) and Wave Packet Envelope Amplitude (right) for March 2, 2009 NYC Snow Event Phase Group
Motivation & Goals • Wave packets linked to extreme weather, regime changes (e.g. Archambault et al. 2009) and predictability issues (Majumdar et al., 2010). • Need to better understand spatial and temporal distribution of wave packets (no robust climatology to date) • Goals: Develop a wave packet tracking method, and use it to produce a climatology, and an ensemble validation. March 2, 2009 – New York City life.com
Wave Packet Amplitude: Data and Methods • Use NCEP/NCAR global 2.5 degree reanalysis (1948-2009) – 300 hPa wind • Implemented the Hilbert transform stream flow technique (Zimin et al. 2006) to extract wave packet envelope amplitude (WPA) • 14-day running mean 300 hPa wind used to establish the stream flow along which packets propagate
Wave Packet Tracking Approach • Relative maxima in wave packet amplitude (WPA) used to track wave packets • Raw WPA spectrally filtered (Cholesky Decomposition – e.g. Wilks, 2006) at T21 resolution to reduce noise • Modified Hodges (2009) TRACK program for packets to obtain cost optimization of user specified maximum displacement and smoothness parameters • Also, to be included in the climatology: --A packet must propagate for at least 48 hours and attain a WPA maximum of 20 m s-1 sometime during its life cycle.
Verification and Some Challenges X X • Verification over three months (JAN-MAR, 2009), using ageostrophic geopotential flux divergence (AGFD) (fromChang, 2000 – eq. 2) • Probability of significant packet detection: ~93% (2366 points) • False alarm rate: ~8% (74 tracked packets, 6 of them likely not significant) • WPA maxima often split or move erratically when encountering obstacles (split flows, wave breaks, mountain barrier crossings) – this may cause TRACK to assign multiple track IDs to one wave packet.
Object Attribution WPA (> 10 m s-1 masked), AGFD, and Raw Track Labels Nearest Neighbor Object Attribution for Each Feature Point X X
Track Merging Rules • Two types of merges supported: One Time Step Before Merge Occurs Time of Merge If more than 50% of the new object area 6-h later is within the previous packet (green shaded area), then the packets are merged.
Long Durating Wave Packet Track and AGFD (JAN 29-FEB 12, 2009)
Spatial Climatology of Wave Packet Activity m s-1 Average WPA for the 1948-2009 (in m s-1): Found by isolating all WPA values > 10 m s-1 associated with significant wave packets, summing those values spatially and dividing by the number of time steps in the climatology.
Wave Packet Formation and Dissipation Locations Formation 10 5 # per 2.5 deg from 1948-2009 Dissipation 10 5
Wave Packet Propagation and Longevity Northern Hemisphere Winter (DJF) Maximum Eastward Propagation (Degrees Longitude) Mean Propagation: 116.5o Median Propagation: 97.9 St. Dev: 87.6 Northern Hemisphere Winter (DJF) Duration (Days) Mean Duration: 5.7 days Median Duration: 4.8 days St. Dev: 3.4 days
AUG Average WPA in Significant Wave Packets by Month (m s-1) Summer to Fall Transition: • Rapid Increase from Aug to Sept. Max over central Pacific and NE N America by Oct. • Wave packets move across N Tibetan Plateau. SEP OCT NOV
Average WPA in Significant Wave Packets by Month (ms-1) Fall to Midwinter Transition: • Activity weakens throughout the winter months in the C Pacifc. Atlantic weakens less. • Fewer tracks across Tibetan Plateau – some splitting around. Park et al. (2010 JAS) show the role of Asian mountains on mid-winter supression. NOV DEC JAN FEB
Average WPA in Significant Wave Packets by Month (ms-1) Winter/Summer Transition: • Tracks increase again in central Pacific by April. • More packets north of Tibetan Plateau by April. • Tracks shift north and weaken by early summer. MAR APR MAY JUN
Northern Hemisphere Winter ENSO Signals DJF Mean WPA (m s-1)- MEI (Wolter, 1987) > 1.0 (El Nino) and < -1.0 (La Nina) El Nino Spatial counts of WPA max WPA average for all packets La Nina
WPA Climo (1991-2009) Two stndev GFS +/- SLP Errors for Day4 2002-2007(Colle and Charles 2011) WPA: 27 Underdeepen Events stronger weaker OBS GFS WPA: 25 Overdeepen Events weaker stronger 1200 UTC 16 JAN 2004
Summary • An objective, object-based algorithm for tracking and analysis of wave packets has been developed for gridded data. • Wave packets are most active (and intense) in the known mid-latitude storm track belts (East of Southern tip of Africa and in the North Pacific and Atlantic basins) along both 45 N and 45 S (as expected by Blackmon 1977). • N. Atlantic activity peaks between October and December. The N. central Pacific activity drops during the midwinter months, which may be related to fewer packets crossing Tibetan Plateau. • During La Nina there is increased pattern amplitude over N. America, while El Ninos favor more activity in the subtropical Pacific. • Medium range cyclone errors in models may be associated with particular wave packet evolutions and difficulties simulating these packets – Future Work….