Download
1 / 7
70 likes | 156 Views
This study examines phosphate concentration levels, site installations, and comparison of laboratory versus field results for contamination monitoring in a geochemical barrier area. Data from diffusive chambers show phosphorus levels over 3-5 years post-PRB installation.

E N D
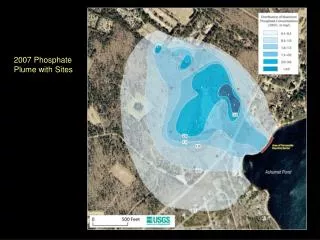
2007 Phosphate Plume with Sites
2007 Phosphate Plume with Sites Sites in red (F707 and F421) are MLSs installed in 2009. Max. Phosphate Conc. at new sites in 2009: F421: 0.42 mg/L F707: 0.29 mg/L
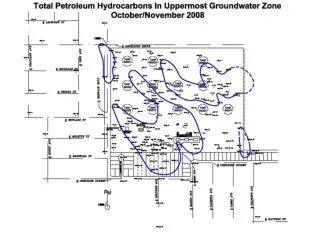
Locations of Permanent seepage meters, vertical multilevel samplers, horizontal multiport samplers, and vertical diffusion samplers in and near the geochemical barrier
Comparison of Laboratory (2009) and Field Phosphate (2008 and 2009) Results along HMPS Site 1
Phosphate Concentration Profiles from Pond-Bottom Vertical Diffusion Chambers (DCs) at 3, 4, and 5 years after PRB Installation
Phosphate Concentration Profiles from Pond-Bottom Vertical Diffusion Chambers (DCs) at 3, 4, and 5 years after PRB Installation
Phosphate Concentration Profiles from Pond-Bottom Vertical Diffusion Chambers (DCs) at 3, 4, and 5 years after PRB Installation