Download

1 / 31
310 likes | 334 Views
This research aims to develop a unified approach to 3D model matching using scale-space representations. The goal is to enable flexible content-based retrieval of CAD data and manage large-scale engineering databases. The approach integrates ideas from computer vision, pattern recognition, computer-aided design, solid modeling, and computational geometry.

E N D
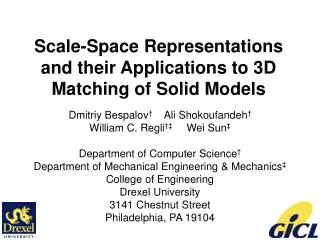
Scale-Space Representations and their Applications to 3D Matching of Solid Models Dmitriy Bespalov† Ali Shokoufandeh† William C. Regli†‡ Wei Sun‡ Department of Computer Science† Department of Mechanical Engineering & Mechanics‡ College of Engineering Drexel University 3141 Chestnut Street Philadelphia, PA 19104
Goals • Flexible content-based, feature-based and shape-based retrieval of CAD data • Manage large-scale engineering databases • Propose a unified approach to 3D model matching based on ideas spanning • Computer Vision & Pattern Recognition • Computer Aided Design & Solid Modeling • Computer Graphics & Computational Geometry • Integrate and test new algorithms with the National Design Repository (http://www.designrepository.org)
Selected Related Work • Comparing Solid Models (SM & Engineering community) • Feature relationship graphs [Elinson et al. 97; Cicirello and Regli 99,00,01,02] • Automatic detection of part families [Ramesh et al 00] • Topological similarity assessment [Sun et al 95; McWherter et al 01,02] • Comparing Shape Models (Graphics community) • Multi-resolutional Reeb Graphs [Hilaga et al., 01] • Shape distributions [Osada, Funkhouser et al, 01,02,03]; [Ip et al 02,03] • 2D views of 3D objects [Cyr and Kimia, 01] • Hierarchical graph matching (Computer Vision community) • [Shokoufandeh et al 99], coarse-to-fine bipartite matching to multi-scale blobs; • [Siddiqi et al 99], spectral graph characterization for matching of shock graphs; • [Pelillo et al 99] hierarchical matching as a maximum clique problem; • [Shokoufandeh et al 02] combined spectral and geometric neighborhood information to match multi-scale blob and ridge decompositions • Other Related Work • [Lamdan/Wolfson 88]; S3 [Berchtold et al SIGMOD 97]; [Smith et al IEEEToNN 97];[Elber et al 97,99,01]; 3DBase [Cybenko et al 96,97]; [Szykman et al 99,00,01];
Traditional CAD Representation • Watertight boundary-representation solid • Implicit surfaces • Analytic surfaces • NURBS, etc • Topologically and geometrically consistent • Produced by kernel modelers and CAD systems
Traditional Shape Representation • Usually a mesh or point cloud • Usually an approximate representation • No explicit in/out • Sometimes error prone • STL files, acquired data • Produced by CAD systems, animation tools, laser scanners, etc
Our Previous Work • Implemented Reeb Graph based matching technique introduced by [Hilaga et al., 01] • Reeb graph: an object skeleton determined using continuous scalar function µ defined on object • Mathematical basis in Morse theory • Reeb graph representations • Are invariant to translation and rotation • Can be multi-resolutional, i.e. hierarchical, for faster matching of objects and classes
~ = not similar ~ = ~ = not similar not similar Non-similar model False-positives Summary of the Experiments • There are often false-positives and non-similar models • Changes in topology affect performance • Only significant shape deformations affect performance • Can classify groups with homogeneous topology • Is sensitive to quality of mesh refinement
What is a Scale Space Representation? • Commonly used for Coarse-to-Fine representations of an object • Very popular in computer Vision • Constructed via spatial filters: Gaussian pyramids, Wavelets… • Basic Idea: • At each scale, topologically relevant components will decompose the object into so called salient parts • Recursive application of this paradigm will create the object’s scale space hierarchy
Why Scale Space Representation? • A unified framework for matching • Different features can be parameterized as different scale space decompositions • design, manufacturing, topology or shape features • Robust & consistent across noisy and diverse data sets
Approach to Scale Space Matching of Solid Models • Start with CAD model • Obtain polyhedral representation • Perform geometry-based decomposition • Obtain a segmentation into “features” • Construct hierarchical “feature” graph • Singular value decomposition • Use hierarchical matching to compare graphs
Algorithm Overview (I) • Given model P, compute mesh representation M • Define measurement function: Our d is shortest path (approx) between every two points on M will be captured in a pair-wise distance matrix D. • (similar to approximation ofgeodesic distance measure used by Hilaga in SIGGRAPH 2001) d(p1,p2)
Algorithm Overview (II) 3. DecomposeM into components relevant using a singular value decomposition of distance matrix DNote: this creates a clustering based on the angle between a vector Opi and the basis vectors (ck, ck-1)
Algorithm Overview (III) 4. Recursive feature decomposition using two principle components creates binary feature trees feature tree for simple_bracket feature tree for swivel
simple_bracket swivel Algorithm Overview (IV) 5. Compare feature trees (bottom up dynamic programming) using sub-tree edit distances 6. Calculate model similarity based on an overall similarity of matched components
Algorithmic Complexity • Bisection process: • SVD decomposition takes O(n3). • Polyhedral representation creates a planar graph (2D manifold); if only neighboring vertices are used in construction of the distance matrix, SVD decomposition is faster and takes O(n2). • Graph matching: • n1 & n2 are the number of nodes in the graphs; bis the branching factor (e.g. 2)
Experiments • Measured “technique’s performance”: • Ability of technique to distinguish between human-defined categories • Used distance matrix for illustration of experimental results Models in the dataset Darker regions correspond to higher similarity values Models grouped together Similarity value between two models Desirable result
Empirical Results • Dataset of 40 CAD models from different 10 classes • Classification based on engineering rules, not specifically their shapes
Scale Space Distance Matrix Note: Darker color represents higher similarity.
Controlling Feature Decomposition:When to Stop? Idea: automate by assigning a measurement,f, to assess the “quality” of each bisection Given: d(u,v): the distance between pointsuandvon the model’s surface M:the original model’s point setE: edges connecting points in MM1: an existing component of M Then: Where: Inter-component coherence Cross-component coherence Note: f measures the coherence of a component relative to a potential decomposition.
For Example: Bisection (b=2) • In the case of bisection, compute f(M1) with respect to decomposition of M1 into M2 and M3 • Idea: bisect M1 into M2and M3 if and only if the resulting coherence is better than that of M1 alone:f(M1) < 0.5
Example Decomposition Fork.sat
Example Decomposition Fork.sat
Example Decomposition Fork.sat
Example Decomposition Fork.sat
Example Decomposition Fork.sat
Example Decomposition Fork.sat No notch A small notch
Summary • Research Contributions • A scale-space approach to matching CAD models • Bridging “CAD Features” and “Computer Vision Features” • A general framework for CAD indexing • Empirical validation/assessment of the technique • Future Work • Use Scale-Space representation to index and retrieve solid models in the database • Integrate this approach into the National Design Repository: from 40 parts to 40,000 parts!
Q&A For more informationhttp://gicl.cs.drexel.eduhttp://aal.cs.drexel.eduhttp://www.designrepository.org Sponsored (in part) by:ONR Grant N00014-01-1-0618NSF ITR/DMI-0219176 NSF CAREER Award CISE/IIS-9733545