
Uploaded by
iliana
1 SLIDES
117 VIEWS
10LIKES
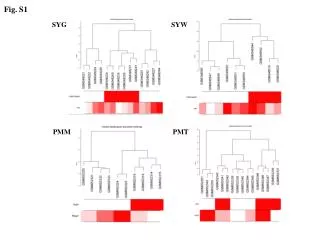
Fig. S1: Analysis of SYG, SYW, PMM, and PMT Data Trends
DESCRIPTION
This figure presents the comprehensive analysis of the datasets SYG, SYW, PMM, and PMT. It highlights significant trends and relationships within the data, facilitating a deeper understanding of the underlying patterns. The visual representation in Fig. S1 illustrates key findings and comparisons across these datasets, enabling researchers to draw valuable insights. The analysis aims to contribute to ongoing research and discussions within this field, offering a foundational understanding to foster further exploration.
Download

1 / 1
Download Presentation 
Fig. S1: Analysis of SYG, SYW, PMM, and PMT Data Trends
An Image/Link below is provided (as is) to download presentation
Download Policy: Content on the Website is provided to you AS IS for your information and personal use and may not be sold / licensed / shared on other websites without getting consent from its author.
Content is provided to you AS IS for your information and personal use only.
Download presentation by click this link.
While downloading, if for some reason you are not able to download a presentation, the publisher may have deleted the file from their server.
During download, if you can't get a presentation, the file might be deleted by the publisher.
E N D


More Related