Download
1 / 15
150 likes | 299 Views
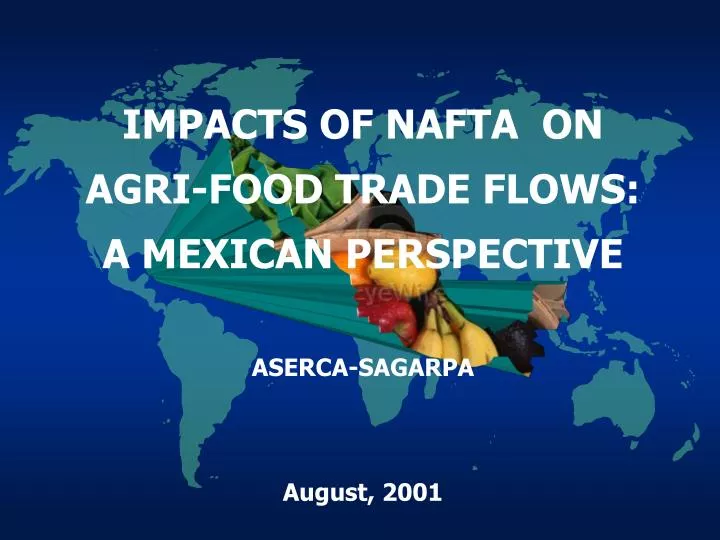
IMPACTS OF NAFTA ON AGRI-FOOD TRADE FLOWS: A MEXICAN PERSPECTIVE ASERCA-SAGARPA August, 200 1. SAGARPA. ASERCA. AGR % 93/99. SECTORS. MEXICAN AGRIFOOD TRADE BALANCE 1993 - 1999. AGRIFOOD EXPORTS 11.6 AGRIFOOD IMPORTS 6.1 AGRICULTURAL EXPORTS 8.3 AGRICULTURAL

E N D
IMPACTS OF NAFTA ON AGRI-FOOD TRADE FLOWS: A MEXICAN PERSPECTIVE ASERCA-SAGARPA August, 2001
SAGARPA ASERCA AGR % 93/99 SECTORS MEXICAN AGRIFOOD TRADE BALANCE 1993 - 1999 AGRIFOOD EXPORTS 11.6 AGRIFOOD IMPORTS 6.1 AGRICULTURAL EXPORTS 8.3 AGRICULTURAL IMPORTS 7.5 PROCESSED FOOD EXPORTS 19.1 PROCESSED FOOD IMPORTS 6.1 10000 8000 6000 4000 Millions dollars 2000 0.0 -2000 -4000 1993 1994 1995 1996 1997 1998 1999 Exports Imports Trade Balance AGRICULTURAL PRODUCTION AND TRADE OUTLOOK • Mexican agrifood sector has successfully integrated to world markets. • During the period 1993-1999, agrifood exports showed an annual rate of growth of 11.6%, while agrifood imports of 6.1%.
FOOD CONSUMPTION COSTS OUTLOOK SAGARPA ASERCA PRODUCTS WITH INCREASES IN PRICES PRODUCTS WTIH DECREASES IN PRICES • Tomatoes 61.5% • Peppers 88.6% • Avocados 17.5% • Guavas 19.2% • Rice 2.8% • Dry edible beans 7.8% • Oranges 15.4% • Apples 9.1% • Opening of Mexican economy to international competition has influenced the evolution of most consumer prices, including food. • No single food price in Mexico is under control by the government. • The consumer price index for food grew 6.1% in 2000, 2.9 percentage points below general inflation.
AGRICULTURAL EXPORTS/AGRICULTURAL GDP RATIO 25,000 35 29.4% 30 20,000 25 21.1% 20.6% 20.4% Million dollars 15,000 20 (%) 20.3% 15 10,000 13.0% 10 5,000 5 0 0 1994 1995 1996 1997 1998 1999 Agricultural Exports México-World Agricultural Exports / Agricultural GDP (%) Agricultural GDP AGRICULTURAL EXPORTS / AGRICULTURAL GDP RATIO Agricultural exports have gained importance in agricultural GDP: • 21.1 per cent of agricultural GDP is generated by exports. • 15.9 per cent of agri – food GDP is generated by exports.
AGRIFOOD EXPORTS/TOTAL EXPORTS RATIO, MEXICO – WORLD Million dollars AGR 99/94 Concept 1994 1995 1996 1997 1998 1999 Total exports of Mexico 60,817.2 79,540.6 96,003.7 110,236.8 117,459.6 136,391.1 17.53 Agri – food exports Mexico - World 4,031.7 5,786.2 5,724.7 6,337.5 6,746.0 6,985.9 11.62 Agri – food exports / Total Exports of Mexico (%) 6.6 7.3 6.0 5.7 5.7 5.1 (5.03) PERFORMANCE OF MEXICAN AGRIFOOD EXPORTS WITH NAFTA AND REST OF THE WORLD AGR 7,000 10.9% 6,000 5,000 (Million dollars) 4,000 3,000 2,000 AGR 15.8% 1,000 - (Years) 1994 1995 1996 1997 1998 1999 Rest of the World Mexico-NAFTA Source: SAGARPA and Secretary of Economics. MEXICAN AGRICULTURAL EXPORTS FIGURES The rate of agri-food exports to total exports has been diminishing, even though agri-food exports have increased at an average growth rate (AGR) of 11.6 per cent. Data shows no trade diversion on the side of exports due to NAFTA. Trade remains concentrated with NAFTA Partners.
AGRIFOOD IMPORTS/TOTAL EXPORTS RATIO, MEXICO – WORLD Million dollars AGR 99/94 Concept 1994 1995 1996 1997 1998 1999 PERFORMANCE OF MEXICAN AGRIFOOD IMPORTS Total exports of Mexico 60,817.2 79,540.6 96,003.7 110,236.8 117,459.6 136,391.1 17.53 WITH NAFTA AND REST OF THE WORLD Agri – food imports Mexico - World 7,343.2 5,252.9 7,678.3 8,610.1 8,546.7 6,985.9 11.62 ARG Agri - food imports / Total Exports of Mexico (%) 9,000 4.4% 12.1 6.6 8.0 6.9 7.3 6.3 (12.2) 8,000 7,000 6,000 5,000 (Million dollars) 4,000 3,000 ARG 2,000 (2.2%) 1,000 - (Years) 1994 1995 1996 1997 1998 1999 Rest of the World Mexico-NAFTA Source: SAGARPA and Secretary of Economics. MEXICAN AGRICULTURAL IMPORTS FIGURES Food imports vs total exports measures vulnerability according to FAO. This index is decreasing for Mexico, due to the performance of the economy as a whole. Data shows trade diversion on the import side due to the NAFTA.
AGRICULTURAL TRADE BALANCE/AGRICULTURAL GDP RATIO Million dollars Concept 1994 1995 1996 1997 1998 1999 Agricultural Trade Balance Mexico - World (1,332.3) 1,176.6 (1,433.0) (730.7) (1,134.4) (977.6) Agricultural GDP 22,216.4 14,348.3 18,393.4 20,109.5 20,080.2 20,488.5 Agricultural Balance/ Agricultural GDP (%) (6.0) 8.2 (7.8) (3.6) (5.6) (4.8) Source: SAGARPA with Secretary of Economics data. AGRICULTURAL TRADE BALANCE/AGRI-FOOD GDP RATIO Million dollars Concept 1994 1995 1996 1997 1998 1999 Agri-foodTrade Balance Mexico - World (3,311.5) 533.3 (1,953.6) (1,311.6) (1,864.0) (1,560.9) Agri-food GDP 41,968.1 28,546.4 35,023.5 39,168.4 39,785.8 43,845.6 Agri-food Balance/ Agri-food GDP (%) (7.9) 1.9 (5.6) (3.3) (4.7) (3.6) Source: SAGARPA with Secretary of Economics data. MEXICAN AGRICULTURAL AND AGRI-FOOD TRADE BALANCES The deficit in agri – food products is equal to 3.6 per cent of agri – food GDP.
MEXICAN AGRIFOOD TRADE FLOWS WITH COUNTRIES THAT HAVE SIGNED A FTA BEFORE 1999 (U.S. Dlls.) SAGARPA ASERCA Before Agreement After Agreement Country/Block % Growth NAFTA 1/ 6,499,468.31 10,544,640.36 62.24 Costa Rica 2/ 15,262.94 50,327.45 229.74 Bolivia 2/ 91.62 615.62 571.92 G3 2/ 16,916.45 58,393.59 245.19 Chile 3/ 12,027.09 75,845.81 530.62 Nicaragua 4/ 16,787.36 25,411.71 51.37 Fuente: SAGAR with SECOFI data 1/ Before agreement =1990-1993 average; after agreement = 1994-1998 average 2/ Before agreement= 1990-1994 average; after agreement = 1995-1998 average 3/ Before agreement = 1990-1991 average; after agreement = 1992-1998 average 4/ Before agreement = 1990-1997 average; after agreement = 1998
MEXICAN AGRIFOOD TRADE WITH DIFFERENT BLOCKS SAGARPA ASERCA 1990 1999 10.2 % 3.4 % 9.4 % 1.3 % 12.6 % 74.6 % 6% 82.5 % TLCAN EUROPE MERCOSUR Rest of the World Source: SAGAR with SECOFI data. 1/ Include: agriculture livestock and agrifood • Mexican Agrifood trade is highly concentrated in NAFTA. • In 1990, Mexico’s agrifood trade with NAFTA countries was 74.6% of total agrifood trade, and in 1999 it grew to 82.5%. • Agrifood trade with Europe fell from 12.6% to 6% during the same period.
NORTH AMERICAN FREE TRADE AGREEMENT (NAFTA) SAGARPA ASERCA Agrifood trade Mexico-NAFTA (Millio dollars) AGR 1993/1999 Agrifood EXP. 10.1 % Agrifood Imp. 7.8 % Agrifood. Trade. 8.8 % 14,000 TMAC: 8.8% 12,000 10,000 8,000 6,000 4,000 2,000 0 1990 1991 1992 1993 1994 1995 1996 1997 1998 1999 Exports Imports Source:Secretary of Economics • From 1988 to 1993, agrifood trade between Mexico and NAFTA countries grew 43.2%, while from 1993 to 1999 it grew 66.8%. • Agrifood trade deficit was 2.2 billion dollars, while in 1999 was 1.3 billion dollars, a decrease of 40.3%.
MEXICAN AGRIFOOD IMPORTS FROM U.S.A. AND CANADA SAGARPA ASERCA AGRIFOOD IMPORTS OF MEXICO FROM NAFTA COUNTRIES (millons of US dlls.) CONCEPT 1993 1999 % AGR 93/99 CONCEPT % AGR 93/99 AGRIFOOD IMPORTS 4,492 7,045 7.8 AGRIFOOD EXPORTS 10.1 AGRIC. IMPORTS 2,734 4,698 9.4 AGRIC. EXPORTS 7.1 FOOD IMPORTS. 1,759 2,347 4.9 FOOD EXPORTS 17.9 Source: SAGAR with SICM data • In the last 6 years, an average 66% of our agrifood imports are agriculture and livestock products, and 34% are processed products. • During 1993–1999, Mexican agrifood imports increased in average 7.8%, 2.3 points less than agrifood exports.
MEXICAN AGRIFOOD EXPORTS TO U.S.A. AND CANADA SAGARPA ASERCA Mexican agrifood exports to Canada Growth 1993 – 1999: 126% 77.07 80.00 68.96 NAFTA 70.00 61.09 60.00 43.80 Million dollars 42.88 50.00 34.12 40.00 28.98 30.00 20.00 10.00 0.00 1993 1994 1995 1996 1997 1998 1999 Mexican agrifood exports to U.S.A. Growth 1993 – 1999: 77.4% 5,696 5,382 6,000 4,933 4,790 NAFTA 4,555 5,000 3,437 4,000 3,211 Million dollars 3,000 2,000 1,000 0 1993 1994 1995 1996 1997 1998 1999 • From 1993 to 1999, the Mexican agrifood exports to U.S.A.. grew 77.4%, while to Canada 125.8% • Mexico has consolidated its position as the second supplier of U.S.A. markets. • The share of Mexican agrifood products in total U.S. Imports grew from 9.1% in 1993, to 11.5% in 1999, only second to Canada.
SAGARPA ASERCA AGRICULTURAL PRODUCTION AND TRADE OUTLOOK • Total agrifood exports show an annual rate of growth of 10.1% during 1999-2000, while total agrifood imports of 13.7%. • Agrifood deficit increased from 1,569.4 million dollars in 1999 to 2,035.6 million dollars in 2000. • IMPORT PRODUCTS • WITH SIGNIFICANT INCREASE • 1999 - 2000 • Bovine meat 30.2% • Poultry meat 29.4% • Raw cotton 41.5% • Milk powder 26.8% • Fresh apples 36.2% • EXPORT PRODUCTS • WITH SIGNIFICANT INCREASE • 1999 - 2000 • Peppers 40.9% • Onions 17.5% • Chickpeas 22.2% • Avocados 25.7% • Bananas 36.3% • Bovine live cattle 41.4% • Pork meat 28.8% • Honey 37.3%
PRODUCE EXPORTS FROM MEXICO TO NAFTA COUNTRIES SAGARPA ASERCA MEXICAN VEGETABLES SHARE IN U.S. IMPORTS (1999) MEXICAN FRUITS SHARE IN U.S. IMPORTS (1999) 96 91 100 100 86 90 90 76 75 72 70 69 71 80 80 70 70 52 60 60 % % 50 50 40 40 30 30 20 20 10 10 0 0 Watermelon Mango and guava Papaya Melón Strawberry, blueberry and raspberry Tomatoe Onion Asparragus Eggplant and cabbage Cucunber • The Mexican produce exports to the United States, have increased 72.9%, from 1.4 billion dollars in 1993 to 2.4 billion dollars in 1999. • Exports to Canada increased 70.9% in the same period, from 15.2 to 25.9 million dollars. • Mexico has increased its participation in U.S. Imports, in some cases in more than 50.0%
THE MAIN MEXICAN AGRIFOOD EXPORTS TO U.S.A. AND CANADA SAGARPA ASERCA PRODUCT Exports growth 1993 – 1999 (%) Importance as a U.S.A. supplier 1993 1999 ASPARAGUS 709 1 1 GARLIC 127 2 1 PEPPER 66 1 1 CUCUMBER 69 1 1 TOMATOE 36 1 1 LEMON 71 1 1 GRAPE 169 2 1 AVOCADO ------- 0 2 BEER 233 2 2 COCKIES 193 2 2 CANDIES 313 4 3 OILSEEDS 106 2 1 VEGETABLES 71 1 1 Source: SAGAR with USDOC data • In many products, Mexico has consolidated its position as the most important supplier of United States markets. • In 1999, Mexico was the supplier of 221 products of the 2,070 that conformed the agriculture and livestock United States tariff. This represents 53.5% more products than in 1993.