Download
1 / 41
410 likes | 598 Views
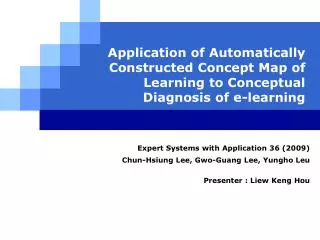
Application of Automatically Constructed Concept Map of Learning to Conceptual Diagnosis of e-learning. Expert Systems with Application 36 (2009) Chun-Hsiung Lee, Gwo-Guang Lee, Yungho Leu Presenter : Liew Keng Hou. Outline. Introduction Purpose in This Study Research Approach

E N D
Application of Automatically Constructed Concept Map of Learning to Conceptual Diagnosis of e-learning Expert Systems with Application 36 (2009) Chun-Hsiung Lee, Gwo-Guang Lee, Yungho Leu Presenter : Liew Keng Hou
Outline • Introduction • Purpose in This Study • Research Approach • Experiment and Data Analysis • - test & Analysis • Conclusion and Discussion
What is Concept Map? A B Epistemological order of concept map
Types Concept Map for Learning • Completely manual • Semi-automatic • Automatic
Outline • Introduction • Purpose in This Study • Research Approach • Experiment and Data Analysis • - test & Analysis • Conclusion and Discussion
Purpose in This Study • Develop the intelligent Concept Diagnostic System(ICDS) of an automatically constructed concept map of learning by the algorithm of Apriori for Concept Map • Teachers were provided with the constructed concept map of learners to diagnose the learning barriers and misconception of learners. • Remedial-Instruction Path(RIP) was constructed through the analyst of the concepts and weight in the concept map to offer remedial learning. • Statistical methods were used to analyze whether the learning performance of learners can be significantly enhanced after they have been guided by the RIP.
Remedial-Instruction Path A Remedial-Instruction Path B C D E Relationships of the epistemological order
Outline • Introduction • Purpose in This Study • Research Approach • Experiment and Data Analysis • - test & Analysis • Conclusion and Discussion
Presetting Conceptual Weight ‘0’: not relevant‘1’: strongly relevant
Recording Test Portfolio of Testees ‘0’: Student answered correctly the test item‘1’: Student failed to answer correctly the test item
Find Out All Large Item sets(Cont.) • Using association rules of data mining • Sets Min support(MS) = 0.4(Depends on teacher) • Number of testees= 5 • Questions with wrong answers given by testees has to be ≥ MS x N (0.4 x 5 = 2)
Find Out All Large Item sets(Cont.) MS ≥ 0.4 0.4 x 5 ≥ 2
Ruling the Test Question Association • The confidence level of the test question association rule QQ is the concept of conditional probability. • It implies that a testee gives a wrong answer to Question Q, there is a probability for the testeeto give a wrong answer to Question Q, too • The estimated confidence level formula is
Using Association Rules of Data Mining Confidence(Q1Q2)=P(Q2|Q1)= 100% Confidence(Q1Q2)=P(Q1|Q2)= 75% Confidence(Q3Q2)=P(Q3|Q2)= 80% Note: ‘0’: Student answered correctly the test item ‘1’: Student failed to answer correctly the test item
Using Association Rules of Data Mining • Let the minimum confidence(MC) level be below 70% • Rule 1. Confidence (Q1 Q2) = 100%Rule 2. Confidence (Q1 Q3) = 100%Rule 3. Confidence (Q2 Q1) = 75%Rule 4. Confidence (Q2 Q3) = 100%Rule 5. Confidence (Q3 Q2) = 80%Rule 6. Confidence (Q4 Q3) = 100%Rule 7. Confidence (Q5 Q4) = 100%
Relationship Between Concept and Concept • Conversion from “test question association rules” to the effect of “relation between concept and concept” • Q: th test questionC: th conceptRQC: relavance degree between Q and CWCC: relevance degree between CandX
Relationship Between Concept and Concept • Q1 Q2 = C1C2 = Confidence(Q1 Q2) RQ1C1 RQ2C2 = 1 1 1 = 1 • Q1Q3 = C1C3 = Confidence(Q1Q3) RQ1C1 RQ3C3= 1 1 0.5 = 0.5 • Q2Q1 = C2C1 = Confidence(Q2Q1) RQ2C2 RQ1C1= 0.75 1 1 = 0.75 • Q2Q3 = C2C1 = Confidence(Q2Q3) RQ2C2 RQ3C1= 1 1 0.5 = 0.5(0.5 < 0.75(3)) = C2C3 = Confidence(Q2 Q3) RQ2C2 RQ3C3= 1 1 0.5 = 0.5 • Q3 Q2 = C1C2 = Confidence(Q3 Q2) RQ3C1 RQ2C2 = 0.8 0.5 1 = 0.4(0.4 < 1(1)) = C3C2 = Confidence(Q3 Q2) RQ3C3 RQ2C2 = 0.8 0.5 1 = 0.4 Rule 2. Confidence (Q3Q1) = 100% Rule 4. Confidence (Q2Q3) = 100%
Relationship Between Concept and Concept • Q4 Q3 = C2C3 = Confidence(Q4 Q3) RQ4C2 RQ3C3 = 1 0.4 0.5 = 0.2(0.2 < 0.5(4)) = C4C3 = Confidence(Q4Q3) RQ4C4 RQ3C3= 1 0.3 0.5 = 0.15 • Q5Q4 = C5C1 = Confidence(Q5Q4) RQ5C5 RQ4C1= 1 1 0.3 = 0.3= C5C2 = Confidence(Q5 Q4) RQ5C5 RQ4C2= 1 1 0.4 = 0.4 = C5C1 = Confidence(Q5 Q4) RQ5C5 RQ4C4= 1 1 0.3 = 0.3
Preliminary Concept Maps(Stage 1) C1 0.3 1 0.75 C2 C5 0.4 0.5 0.4 0.5 0.3 C3 C4 0.2
Preliminary Concept Maps (Cont.) • Q3 Q2 = C1C2 = Confidence (Q3 Q2) RQ3C1 RQ2C2= 0.8 0.5 1 = 0.4 (0.4 < 1(1))Q3 Q2 = C3C2 = Confidence(Q3 Q2) RQ3C3 RQ2C2= 0.8 0.5 1 = 0.4 • Q4 Q3 = C2C3 = Confidence (Q4 Q3) RQ4C2 RQ3C3= 1 0.4 0.5 = 0.2 (0.2 < 0.5(4))Q4 Q3 = C4C3 = Confidence (Q4 Q3) RQ4C4 RQ3C3= 1 0.3 0.5 = 0.15 • Q5Q4 = C5C1 = Confidence (Q5 Q4) RQ5C5 RQ4C1= 1 1 0.3 = 0.3Q5 Q4 = C5C2 = Confidence (Q5 Q4) RQ5C5 RQ4C2= 1 1 0.4 = 0.4Q5 Q4 = C5C1 = Confidence (Q5 Q4) RQ5C5 RQ4C4= 1 1 0.3 = 0.3 • Q1 Q2 = C1C2 = Confidence (Q1 Q2) RQ1C1 RQ2C2= 1 1 1 = 1 • Q1 Q3 = C1C3 = Confidence (Q1 Q3) RQ1C1 RQ3C3= 1 1 0.5 = 0.5 • Q2 Q1 = C2C1 = Confidence (Q2 Q1) RQ2C2 RQ1C1= 0.75 1 1 = 0.75 • Q2 Q3 = C2C1 = Confidence (Q2 Q3) RQ2C2 RQ3C1= 1 1 0.5 = 0.5 (0.5 < 0.75(3))Q2 Q3 = C2C3 = Confidence(Q2 Q3) RQ2C2 RQ3C3= 1 1 0.5 = 0.5
Preliminary Concept Maps(Cont.) C1 0.3 1 0.75 C2 C5 0.4 0.5 0.4 0.5 0.3 C3 C4 0.2
Adjusting Concept Map of Learning(Stage 2) NP: Number of father concepts contained in the son conceptNC: Number of son concepts contained in the father concept
Complete Concept Map C5 WC5C4 = 0.3 WC5C1 = 0.3 WC5C2 = 0.4 C1 C4 C2 WC1C2 = 1 WC2C3 = 0.5 WC1C3 = 0.5 WC4C3 = 0.2 C3
Determination of Learning barrier • Calculate the ratio of wrong answers given in the test portfolio:ER(C) = • : weight of the th concept of the th test question which was wrongly answer: weight of the th concept in the whole test paper
Table of Ratio of Wrong Answer (Failratio) ER(C1) = = 0.44 ER(C2) = = 0.29
Algorithm of Remedial-Instruction Path 010 Void main () 020 Call Find_Remedial-Instruction_Path(k, Fault-Concept) 030 End 040 050 //Cj denotes the FaulConcept, and k denoted the index of a father concept on Cj 060 Sub Find_Remedial-Instruction_Path(k,Cj) 070 //judge whether the failratio of Concept Cj is greater than the tolerance for the ratio of the giving wrong answers. 080 If ER(Cj) failratio then 090 Push Cj 100 W = Max{WCiCjj1 5 i 5 n} 110 While (CihiRootConcept)do //Not Find to Root-Concept 120 push Ci base on W 130 Wend 140 While Stack is not empty //Find to Root-Concept 150 //RIP: Remedial-Instruction_Path 160 RIP = Find_Remedial-Instruction_Path(i,Pop()) 170 Wend 180 End if 190 End Sub
Outline • Introduction • Purpose in This Study • Research Approach • Experiment and Data Analysis • - test & Analysis • Conclusion and Discussion
Design of Experiment and Data Analysis • Target of Study • 245 Grade 1 students of a senior high school • Pre-test of “Visual Basic Programming Language” • Table of discrimination index of Questions <0.2
Cluster • In order to understand the difference of concept maps produced from the test portfolio of students at different standards • Optimal ratio is 27% for the high-score and low-score clusters
Sub-Cluster • Experimental group: The RIP in concept map served as the learning guide • Control group: Traditional non-guided network learning way was adopted
Outline • Introduction • Purpose in This Study • Research Approach • Experiment and Data Analysis • - test & Analysis • Conclusion and Discussion
- test & Analysis • : significant standard • H0 : There is a significant difference between the mean of experimental group and the mean of control group • If P-value <, then H0is rejected. • If P-value , then H0 is not rejected
-test of Independent Samples of Experimental Group and Control Group of Three Cluster * < 0.1 * < 0.01
Outline • Introduction • Purpose in This Study • Research Approach • Experiment and Data Analysis • - test & Analysis • Conclusion and Discussion
Conclusion and Discussion • Discrimination index of test questions • If the test question is too simple or difficult? • Attribute of test questions • Which type of test question? • Learning performance • Which cluster(s) has better performance?