Download
1 / 5
310 likes | 819 Views
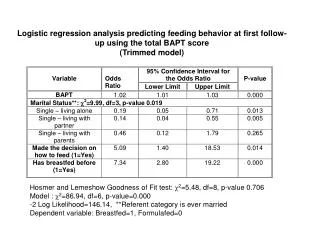
Logistic regression analysis predicting feeding behavior at first follow-up using the total BAPT score (Trimmed model). Hosmer and Lemeshow Goodness of Fit test: 2 =5.48, df=8, p-value 0.706 Model : 2 =86.94, df=6, p-value=0.000

E N D
Logistic regression analysis predicting feeding behavior at first follow-up using the total BAPT score (Trimmed model) Hosmer and Lemeshow Goodness of Fit test: 2=5.48, df=8, p-value 0.706 Model : 2=86.94, df=6, p-value=0.000 -2 Log Likelihood=146.14, **Referent category is ever married Dependent variable: Breastfed=1, Formulafed=0
Logistic regression analysis predicting feeding behavior at first follow-up using the significant demographic variables and the four subscale scores.(Trimmed model) Hosmer and Lemeshow Goodness of Fit test: 2=4.67, df=8, p-value 0.792 Model : 2=104.40, df=9, p-value=0.000 -2 Log Likelihood=128.68 **Referent category is ever married Dependent variable: Breastfed=1, Formula fed =0
Logistic regression analysis predicting feeding behavior at second follow-up using total BAPT score. (Trimmed model) Hosmer and Lemeshow Goodness of Fit test: 2=17.19, df=8, p-value 0.028 Model : 2=72.48, df=3, p-value=0.000 -2 Log Likelihood=118.21 Dependent variable: Breastfed=1, Formulafed=0
Logistic regression analysis predicting feeding behavior at second follow-up using the significant demographic variables and the four subscale scores. (Trimmed model) Hosmer and Lemeshow Goodness of Fit test: 2=6.24, df=8, p-value 0.620 Model 2=85.901, df=8, p-value=0.000 -2 Log Likelihood=104.79 *Referent category is income greater than $30,000 Dependent variable: Breastfed=1, Formula fed =0
Using the Breastfeeding Attrition Prediction Tool to predict breastfeeding behavior in African-American women Manorama M. Khare*, PhD, MS, Noel Chàvez, PhD, RD, LD, Timothy Johnson, PhD.