Demand
340 likes | 510 Views
Demand. Demand and Supply Game. Place a value of each token Black = 50 cent Red = 20 cent. Price rises when quantity supplied is scarce and demand increases. Price decreases when quantity supplied increases and as a result demand increases. Demand.

Demand
E N D
Presentation Transcript
Demand and Supply Game Place a value of each token Black = 50 cent Red = 20 cent
Price rises when quantity supplied is scarce and demand increases Price decreases when quantity supplied increases and as a result demand increases
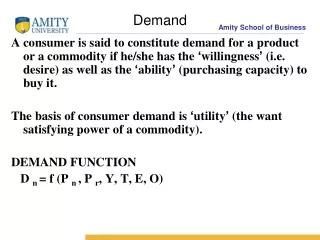
Demand • The amount consumers desire to purchase at various prices at any given time • Demand does not necessarily mean a consumer WILL buy, but refers to a good or service they WOULD LIKE to buy
Effective Demand • Consumers must be willing to buy AND be capable of paying the price set by the supplier
Law of Demand If Price rises – Quantity demanded falls P Q If Price falls – Quantity demanded rises P Q
Individual Demand • Individual Demand Schedule Lists the different quantities of a good that an individual consumer is prepared to buy at each price
Market Demand • Market Demand Schedule Lists the different quantities of a good that all consumers in the market are prepared to buy at each price. It is derived by adding together all the individual demand schedules for the good
Demand Curve • At higher prices, consumers are generally willing to purchase less than at lower prices • Demand curve is said to have a negative slope - downward sloping from left to right
Point Price per g Market Demand A 20 cent 700 kilogrammes Price (cent per g) Demand A Quantity (kilogrammes: 000s)
Point Price per g Market Demand A 20 cent 700 kilogrammes B 40 cent 500 kilogrammes Price (cent per g) B A Quantity (kilogrammes: 000s)
Point Price per g Market Demand A 20 cent 700 kilogrammes B 40 cent 500 kilogrammes C 60 cent 350 kilogrammes C Price (cent per g) B A Quantity (kilogrammes: 000s)
Point Price per g Market Demand A 20 cent 700 kilogrammes B 40 cent 500 kilogrammes C 60 cent 350 kilogrammes D 80 cent 200 kilogrammes D Price (cent per g) C B A Quantity (kilogrammes: 000s)
Point Price per g Market Demand A 20 cent 700 kilogrammes B 40 cent 500 kilogrammes C 60 cent 350 kilogrammes D 80 cent 200 kilogrammes E 100 cent 100 kilogrammes E D Price (cent per g) C B A Quantity (kilogrammes: 000s)
An Increase in Demand D1 D2 P Price Q1 Q2 Quantity
A Decrease in Demand D2 D1 P Price Q2 Q1 Quantity
Factors affecting the demand for a good The Demand Function Dx = f ( Px, Pog, Y, T, E, G, U)
The Demand Function Dx = f ( Px, Pog, Y, T, E, G, U) • Px = Goods which obey and do not obey the Law of Demand • Pog = Price of Complimentary Goods and Cost of Substitute Goods • Y = Income of consumer • T = Consumer tastes and preferences • E = Consumers expectations regarding future prices • G = Government regulations • U = Unplanned factors
Demand for a good depends on its own priceIf price rises quantity demanded fallsIf price falls quantity demanded rises P 2 P 1 Q 2 Q 1 Quantity Demanded
Demand for a good depends on the price of other goods • Complimentary Goods Goods which are used jointly. The use of one involves the use of the other - E.g. bread and butter, cars and petrol • Substitute Goods Goods which satisfy the same needs and thus can be considered as alternatives to each other – E.g. Coke and Pepsi or Tea and Coffee
Complimentary Goods D 1 D 2 D 2 D 1 An increase in price of a complementary good causes the demand for good X to fall An fall in price of a complementary good causes the demand for good X to rise
Substitute Goods (The Substitute Effect) D 2 D 1 D 1 D 2 An increase in price of a substitute good causes the demand for good X to rise An fall in price of a substitute good causes the demand for good X to fall
Demand for a good depends on level of income (The Income Effect) • Normal Goods A normal good is a good with a positive income effect. A rise in income causes more of it to be demanded, while a fall in income causes less of it to be demanded • Inferior Goods An inferior good is a good with a negative income effect. A rise in income causes less of it to be demanded, while a fall in income causes more of it to be demanded
Normal Goods D 2 D 1 D 1 D 2 An fall in income causes the demand for a normal good to fall from D1 to D2 A rise in income causes the demand for a normal good to increase from D1 to D2
Inferior Goods D 1 D 2 D 2 D 1 An increase in income causes the demand for an inferior good to fall from D1 to D2 A decrease in income causes the demand for an inferior good to rise from D1 to D2
Demand depends on Consumer Tastes • If the movement in taste or preferences is in favour of the good it causes an increase in demand which shifts the demand curve to the right • If the movement in taste or preferences is against the good it causes a fall in demand which shifts the demand curve to the left
Movement in Taste D 2 D 1 D 1 D 2 A movement in taste against a good causes demand to fall A movement in taste in favour of a good causes demand to increase
Demand for a good depends on the expectations of consumers • Demand for a good will shift to the right if consumers expect: • The price of good X to be higher in the future e.g. property • A scarcity of good X in the future e.g. oil • Their incomes to be higher in the future e.g. promotion • Demand for a good will shift to the left if consumers expect: • The price of good X to be lower in the future • A plentiful supply of good X in the future • Their incomes will be lower in the future
Consumer Expectations D 2 D 1 D 1 D 2 Demand for Good X will fall if consumers expect lower future prices, abundance or lower future incomes Demand for Good X will rise if consumers expect higher future prices, scarcity or higher future incomes
Demand for a good depends on government regulations • If the government implement a programme which reduces consumption of a particular product than demand for this good will be affected • E.g. The smoking ban / educational campaign to reduce alcohol consumption.
Government Regulations Example: The Smoking Ban D 1 D 2 If the government implement a policy to restrict consumption demand for Good X will fall
Demand for a good depends on unplanned factors If there is a sudden heat wave – an unplanned factor – this may result in an increase in demand for sunscreen and a decrease in the demand of home oil If flash floods occur across the country – an unplanned factor – this may result in an increase in the demand for Wellingtons.
Unplanned Factors Factors such as weather can effect the demand for goods – e.g. a sudden heat wave would increase the demand for sunscreen D 2 D 1