Download
1 / 1
20 likes | 165 Views
Mixed predictive checks. Red shows the model fitted . Green shows the posterior predictive quantities. Blue shows the mixed predictive quantities (new parameters are predicted within the model). π. Mixed Prediction. z g. η. α , β. δ g. g. δ g pred. mixed pred. x gi. post. pred.

E N D
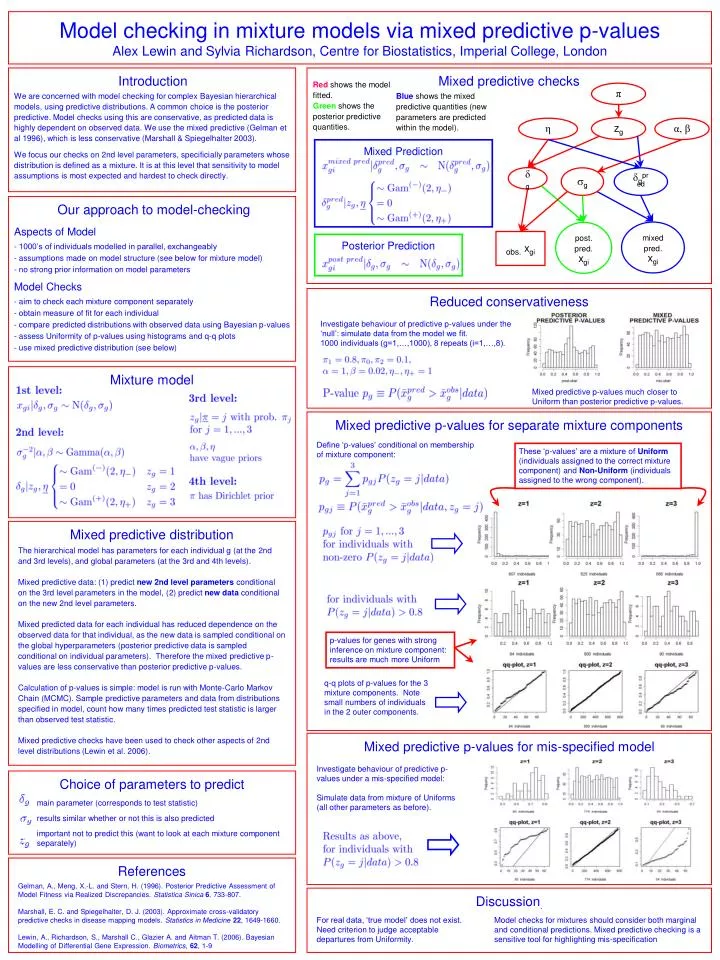
Mixed predictive checks Redshows the model fitted. Greenshows the posterior predictive quantities. Blueshows the mixed predictivequantities (new parameters are predicted within the model). π Mixed Prediction zg η α, β δg g δgpred mixed pred. xgi post. pred. xgi obs. xgi Posterior Prediction Reduced conservativeness Investigate behaviour of predictive p-values under the ‘null’: simulate data from the model we fit. 1000 individuals (g=1,…,1000), 8 repeats (i=1,…,8). Mixed predictive p-values much closer to Uniform than posterior predictive p-values. Mixture model Mixed predictive p-values for separate mixture components Define ‘p-values’ conditional on membership of mixture component: These ‘p-values’ are a mixture of Uniform (individuals assigned to the correct mixture component) and Non-Uniform (individuals assigned to the wrong component). p-values for genes with strong inference on mixture component: results are much more Uniform q-q plots of p-values for the 3 mixture components. Note small numbers of individuals in the 2 outer components. Mixed predictive p-values for mis-specified model Investigate behaviour of predictive p-values under a mis-specified model: Simulate data from mixture of Uniforms (all other parameters as before). Model checking in mixture models via mixed predictive p-values Alex Lewin and Sylvia Richardson, Centre for Biostatistics, Imperial College, London Introduction We are concerned with model checking for complex Bayesian hierarchical models, using predictive distributions. A common choice is the posterior predictive. Model checks using this are conservative, as predicted data is highly dependent on observed data. We use the mixed predictive (Gelman et al 1996), which is less conservative (Marshall & Spiegelhalter 2003). We focus our checks on 2nd level parameters, specificially parameters whose distribution is defined as a mixture. It is at this level that sensitivity to model assumptions is most expected and hardest to check directly. Our approach to model-checking Aspects of Model - 1000’s of individuals modelled in parallel, exchangeably - assumptions made on model structure (see below for mixture model) - no strong prior information on model parameters Model Checks - aim to check each mixture component separately - obtain measure of fit for each individual - compare predicted distributions with observed data using Bayesian p-values - assess Uniformity of p-values using histograms and q-q plots - use mixed predictive distribution (see below) Mixed predictive distribution The hierarchical model has parameters for each individual g (at the 2nd and 3rd levels), and global parameters (at the 3rd and 4th levels). Mixed predictive data: (1) predict new 2nd level parameters conditional on the 3rd level parameters in the model, (2) predict new data conditional on the new 2nd level parameters. Mixed predicted data for each individual has reduced dependence on the observed data for that individual, as the new data is sampled conditional on the global hyperparameters (posterior predictive data is sampled conditional on individual parameters). Therefore the mixed predictive p-values are less conservative than posterior predictive p-values. Calculation of p-values is simple: model is run with Monte-Carlo Markov Chain (MCMC). Sample predictive parameters and data from distributions specified in model, count how many times predicted test statistic is larger than observed test statistic. Mixed predictive checks have been used to check other aspects of 2nd level distributions (Lewin et al. 2006). Choice of parameters to predict main parameter (corresponds to test statistic) results similar whether or not this is also predicted important not to predict this (want to look at each mixture component separately) References Gelman, A., Meng, X.-L. and Stern, H. (1996). Posterior Predictive Assessment of Model Fitness via Realized Discrepancies. Statistica Sinica6, 733-807. Marshall, E. C. and Spiegelhalter, D. J. (2003). Approximate cross-validatory predictive checks in disease mapping models. Statistics in Medicine22, 1649-1660. Lewin, A., Richardson, S., Marshall C., Glazier A. and Aitman T. (2006). Bayesian Modelling of Differential Gene Expression. Biometrics, 62, 1-9 Discussion. For real data, ‘true model’ does not exist. Need criterion to judge acceptable departures from Uniformity. Model checks for mixtures should consider both marginal and conditional predictions. Mixed predictive checking is a sensitive tool for highlighting mis-specification