Download
1 / 15
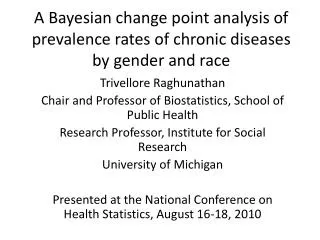
150 likes | 242 Views
Explore shifts in chronic disease prevalence rates by gender and race over time. Analyze data from National Health Interview Survey (1957-2008) in relation to historical events. Discuss disparities and policy impacts.

E N D
A Bayesian change point analysis of prevalence rates of chronic diseases by gender and race Trivellore Raghunathan Chair and Professor of Biostatistics, School of Public Health Research Professor, Institute for Social Research University of Michigan Presented at the National Conference on Health Statistics, August 16-18, 2010
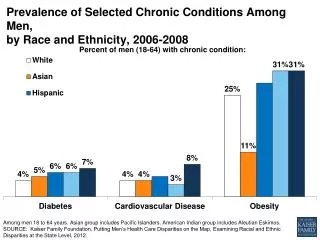
Setup • Need for assessing the health of the nation cannot be understated • NCHS has been in the forefront of collecting data needed • A look back on one such long series • National Health Interview Survey (as it is currently known) • Began in 1957 • Limited Data available prior to 1962 • Relate the prevalence information to time line of our history
Data • Diseases • Diabetes (1957-1959, 1962-2008) • Asthma and Hypertension (1962-2008) • Populations • Overall • Male/Female • White/Black • Time line • Important events (health and economic) • The analysis is preliminary
Prevalence of Diabetes Recession (97) Hostage (79) Recession (80) Vietnam War Medicare (66) Civil Rights (64) Gulf war Recession (90) 9/11 Recession (74) Oil crisis (73-75) Medicaid/AA (65)
Analysis • Fit the model using MCMC or MLE • Calculate • Choose knots based on the time-line • For this analysis choose 5 knots (1965, 1974, 1980, 1990, 2001) • Modification (in progress) • Treat knots as unknown parameters and estimate them from the data
Diabetes by administration Nixon /Ford Carter Johnson Reagan/ Bush Clinton Bush
Asthma Nixon /Ford Carter Johnson Reagan/ Bush Clinton Bush
Hypertension Nixon /Ford Carter Reagan/ Bush Johnson Clinton Bush
Issues and Concerns • Major design changes, instruments, definitions etc • Reflecting such changes in the model development • Any policy change takes time to have an impact. Incorporation of time lag in the model • Outliers • Regardless of these concerns: • Persistent differences between race • Lessening of differences between men and women
Discussion • Relating the time series data to important epics/events can be useful to understand potential effects of policy/cultural changes • Investigation of health disparities across various subpopulations • Subgroups can be determined based on economic, social, cultural aspects of the society • Useful exercise for any democratic society to look at the health of the nation • Thank you NCHS, for this great data source!!