Data Examination and Visualization in Public Finance Research
This guide covers reading and describing data using ASCII, Excel, and Stata files. It includes information on variables, data size, observations, and basic statistical analysis in public finance research.

Data Examination and Visualization in Public Finance Research
E N D
Presentation Transcript
Examine the data Hsien-Ming Lien Dept of Public Finance, NCCU
1.1 Read the data • Read the ASCII file • infile • must provide the variable name, width, and format • Read the excel file • insheet • variable names need to be specified • Read the Stata file • use c:\regstata\elemapi • from the internet
cd • dir • use • save
1.2 Describe the data • Describe the data • Data size • Observations • Variable name • Variable type (string, byte, float, etc)
Variables • api00/academic performance of the school • acs_k3/the average class size in kindergarten through 3rd grade • meals/the percentage of students receiving free meals • full/the percentage of teachers who have full teaching credentials
List • All observations • Some observations • Some variables
Codebook • Number of values • Missing values • Distribution of values
summarize • Provide concise information about variables • Observations • Basic statistics (mean, s.d., min, max) • Option: details
1.3 Tab the data • Tabulate • Tabulate the size of class size
Look at the school and district number to check if they are from the same district
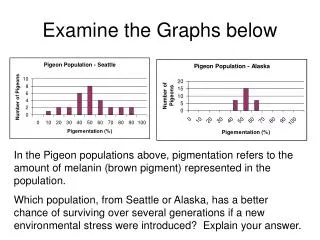
1.4 Graph the data • Use graphs to examine the data • Histogram • Stem and leaf plot