Download
1 / 23
230 likes | 345 Views
ODFW Monitoring & Evaluation in Northeast Oregon PIT Tag Technology. Life Cycle Comparative Survival Profile (BY 2000-05 adult -08 smolts ). Eggs 3700. Summer Parr Minam = 1210(32.7%) Catherine = 902(24.4%). Adult Spawners – SAR’s Minam =3.8(2.5% & 1.4% )

E N D
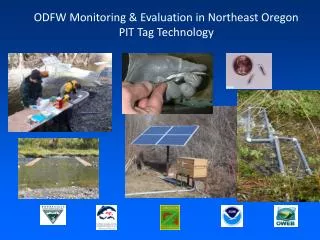
ODFW Monitoring & Evaluation in Northeast Oregon PIT Tag Technology
Life Cycle Comparative Survival Profile(BY 2000-05 adult -08 smolts) Eggs 3700 Summer Parr Minam = 1210(32.7%) Catherine = 902(24.4%) Adult Spawners – SAR’s Minam=3.8(2.5% & 1.4%) Catherine=0.8(1.1% & 0.5%) John Day=3.1(4.5% & 3.3%) Tributary Smolts Egg-SmoltParr-Smolt Minam=278(7.5%) Minam=23.0% Catherine=175(4.7%) Catherine=19.4% John Day=93(2.5%) Trib to Adult 1st Dam Smolts Minam=156(56.0%) Catherine =73(41.8%) John Day=68(73.5%) 1st Dam to Adult Jacks Ocean
Wild Spring Chinook Life History Evaluation • Population smolt abundance • John Day reference populations • Grande Ronde listed populations • Freshwater productivity • Juvenile migration survival • SAR – ocean survival • Fishery predictions
John Day River Wild Spring Chinook Freshwater Productivity
John Day River Adult Chinook Fishery Predictions
Hatchery Chinook Adults: Bonneville Dam to “home”Return Year 2003-2011 Imnaha River • 20,000 PIT tags • 11-30% of releases tagged Lostine River • 6,400 – 16,000 PIT tags • 3-15% of releases tagged R-squared = 0.899 R-squared = 0.856
Juvenile Survival from Catherine Creek to Lower Granite Dam Lower Granite Dam Snake Washington River Oregon River Ronde 40 Kilometers Grande Wallowa Grande Ronde Valley River Lostine N River Catherine Creek
Reach Specific Survival from Catherine Creek to Lower Granite Dam
Mid-Columbia Steelhead Evaluation • Population smolt abundance • Freshwater productivity • Juvenile migration survival • SAR – ocean survival • Adult spawner migration • Hatchery stray rates
Steelhead Run Timing Cumulative Counts @ Bonneville
John Day River Adult Steelhead In-stream PIT detections
Adult Steelhead Detections of Transport Study Groups2007-08 & 2008-2009 Run Years
CSS Hatchery Adult Steelhead Passage Between Bonneville Dam and Lower Granite Dam z-test P < 0.001
Stray Rates Into the John Day for Transported and In-River Migrants % Run Year
Wallowa Stock Steelhead Fishery Evaluation Troy Wallowa Hatchery Joseph La Grande Union
Objectives • Create a new hatchery line from Wallowa stock returning to Grande Ronde in autumn. • Autumn Line may stray less and improve the autumn fishery. • Compare performance of Autumn Line with the standard Wallowa Stock. • Is smolt outmigration survival similar? • Does the Autumn Line return earlier? • Are smolt-to-adult survival rates similar? • Does the Autumn Line stray at a lower rate?
Average Adult Steelhead Return Timing (run years 2006-2010) 25 Bonneville 20 AUTUMN LINE 15 STANDARD STOCK 10 5 25 McNary 20 PERCENT RECOVERED 15 10 5 25 Lower Granite 20 15 10 5 0 7/1 8/5 9/9 10/14 11/18 12/22 WEEK ENDING
Smolt-to-Adult Survival to Bonneville Dam (significantly different, P = 0.004) Autumn line, F1 generation 7 Standard stock 6 Autumn line, F2 generation 5 4 PERCENT SURVIVAL 3 2 62 326 68 69 65 211 82 1 66 47 50 0 2004 2005 2006 2007 2008 BROOD YEAR
PIT Tag TechnologyWhat have we learned? • VSP measures • Life stage survival • Freshwater productivity • Ocean survival • Hatchery fraction • Life history designation • Management solutions • In season fishery predictions • Developed a new hatchery stock • Hatchery strays • Migration corridor contributes significant mortality • Juveniles • Adult steelhead wandering • Freshwater survival is still limiting • John Day vs. Grande Ronde Chinook