Download
1 / 26
260 likes | 396 Views
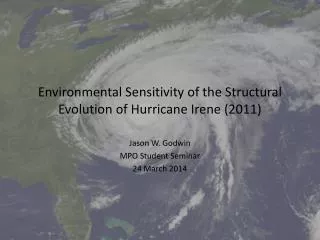
Environmental Sensitivity of the Structural Evolution of Hurricane Irene (2011). Jason W. Godwin MPO Student Seminar 24 March 2014. Background. Tropical cyclone (TC) track forecasts have substantially improved in the last 20 years, but intensity forecasts have improved little.

E N D
Environmental Sensitivity of the Structural Evolution of Hurricane Irene (2011) Jason W. Godwin MPO Student Seminar 24 March 2014
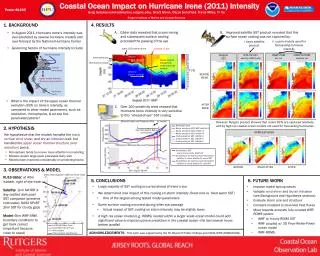
Background • Tropical cyclone (TC) track forecasts have substantially improved in the last 20 years, but intensity forecasts have improved little. • Being able to predict intensity is largely dependent on being able to predict the TC structure. • Hurricane Irene (2011) is a good case study.
Operational Challenges • Track forecast had smaller errors than the five-year average • Intensity errors were larger than the five-year average • Incomplete eyewall replacement cycle led to weaker winds, despite continued deepening • Wind field expanded as pressure fell • Avila and Cangialosi (2011) NHC official track forecasts (black) and track verification (white)
NHC was expecting a strong, compact hurricane… instead, we got a weaker, broader hurricane Intensity forecasts (maximum sustained winds) Northeast quadrant gale force wind radius forecasts Consistent high-bias in intensity forecast Radius of gale-force winds under forecast
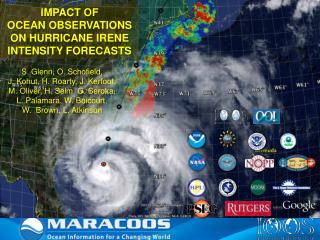
Which environmental features influenced the size and structure of Irene? • The NHC noted that the environmental was conducive for strengthening, but why did Irene not strengthen? • Warm SSTs • Weak vertical wind shear • Moist environment • Even after reaching peak intensity, Irene continued to deepen for another 24-36 hours. 23 24 25 26 27 28 23 24 25 26 27 28
Research Questions • Part 1: Was the structure of Hurricane Irene sensitive to synoptic-scale features? • Vorticity perturbations (Komaromi et al. 2011) • Part 2: Was the structure of Hurricane Irene sensitive to moisture? • Moisture perturbations (Hill and Lackmann 2009)
Part 1: Vorticity Perturbation Technique • Developed by Komaromi et al. (2011) • Allows user to perturb the relative vorticity at an specified point, by a specified amount. • Rebalances momentum, mass, and thermodynamic fields • Integrate WRF with perturbed fields. Vorticity perturbation experiments showing significant initial condition sensitivity for the track of Typhoon Sinlaku (2008)
Methodology • Apply relative vorticity perturbations on important synoptic-scale features that may have influenced the forecast for Hurricane Irene. • Compare against control WRF-ARW simulation and best-track forecast. • Primarily interested in TC size, structure, and intensity.
Model • Version 3.5 of WRF-ARW • 27 km grid spacing (interested distant features on the synoptic scale) • Kain-Fritsch Cumulus Parameterization • WRF Double Moment Six-Class (WMD6) Microphysical Parameterization • Initialized at 00 UTC on 23 August 2011 • Nested within NCEP-GFS • Control simulations and perturbed simulations
Perturbation Experiment #1 • Strengthened shortwave trough over northwestern North Dakota. • Perturbations should be realistic (i.e. within “normal” model error) and local “AFTER THAT TIME...THE TRACK OF IRENE APPEARS TO BE SENSITIVE TO THE TIMING AND AMPLITUDE OF SEVERAL SHORTWAVE TROUGHS MOVING EASTWARD ACROSS THE UNITED STATES/CANADIAN BORDER. THE MODELS ARE SHOWING SOME RUN-TO-RUN VARIABILITY IN HOW MUCH THESE SHORTWAVES WILL AMPLIFY AND DEEPEN THE MEAN TROUGH OVER THE NORTHEASTERN UNITED STATES...WHICH WILL BE CRITICAL TO HOW SOON IRENE TURNS NORTHWARD OR EVEN EAST OF DUE NORTH AT DAYS 4 AND 5.” –NHC Forecast Discussion (11 PM EDT 8/22/2011) 300 hPa relative vorticity difference field (perturbed – control) at 00 UTC on 08/23/2011
Track Control simulation Perturbed simulation NHC Best-Track WRF Forecast Resulted in about a 25 km shift in the track on Day 4, so a small change, but a change nevertheless. Small cross-track error, but the perturbed run also resulted in a slightly faster hurricane.
Intensity Control simulation Perturbed simulation 23 24 25 26 27 28 23 24 25 26 27 28 There was virtually no change in the maximum sustained winds forecast.
Wind Radii Control simulation Perturbed simulation 23 24 25 26 27 28 23 24 25 26 27 28 Again, two very similar forecasts (note that these radii are larger than the NHC ones due to differences and how the radii are computed, so it’s more important to focus on the trends in the radii). It appears that the North Dakota perturbation had little impact on the forecast.
250 hPa PV, winds, and 500 hPa geopotential Control simulation Perturbed simulation 00 UTC 23 August 2011 00 UTC 24 August 2011 00 UTC 25 August 2011 00 UTC 26 August 2011 00 UTC 27 August 2011 00 UTC 28 August 2011
Ongoing work • Perturb features during the simulation (WRF restart) • Perturb the TC vortex itself (upper-level anticyclone, or low-level cyclone)
Part 2: Moisture Perturbations • Uses the same technique as Komaromi et al. (2011) for defining the perturbations, but adjusts water vapor mixing ratio to start • Rebalances mass, momentum, and thermodynamic fields • Hill and Lackmann (2009) used varying moisture profiles in WRF-ARW idealized simulations to investigate how moisture influenced TC size. They hypothesized that a more moist environment led to a larger TC.
Moisture Perturbation Experiment #1 • Performed a dry perturbation in which the TC core, and near storm environment were “dried out”. • Reducing moisture should act to cool the warm core (via evaporative cooling) and reduce convective instability. 700 hPa water vapor mixing ratio difference (perturbed – control) and sea-level pressure at 00 UTC on August 23, 2011
Track NHC Best-Track WRF Forecast Control simulation Perturbed simulation The perturbed simulation shows significant degradation of the track forecast with large cross-track errors, and a much slower storm. It is likely that this is due to a weaker, shallower storm compared to the control simulation.
Intensity Control simulation Perturbed simulation 23 24 25 26 27 28 23 24 25 26 27 28 As expected, the drier storm core and near-storm environment leads to a weaker storm, though later in the forecast period, the perturbed simulation begins to “catch up” to the control simulation as moisture off the southeastern U.S. coast begins to be entrained by Irene.
Wind radii Control simulation Perturbed simulation The drier storm environment results in a smaller storm, which is consistent with Hill and Lackmann (2009).
10-meter winds and sea level pressure Control simulation Perturbed simulation Max winds: 27.6 m/s | Min pressure: 999 hPa Max winds: 33.0 m/s | Min pressure: 977 hPa Max winds: 37.1 m/s | Min pressure: 961 hPa Max winds: 41.2 m/s | Min pressure: 948 hPa Max winds: 32.4 m/s | Min pressure: 956 hPa Max winds: 41.1 m/s | Min pressure: 951 hPa Max winds: 25.4 m/s | Min pressure: 993 hPa Max winds: 26.4 m/s | Min pressure: 986 hPa Max winds: 37.9 m/s | Min pressure: 961 hPa Max winds: 38.4 m/s | Min pressure: 950 hPa Max winds: 27.6 m/s | Min pressure: 999 hPa Max winds: 39.5 m/s | Min pressure: 953 hPa 00 UTC 28 August 2011 00 UTC 24 August 2011 00 UTC 25 August 2011 00 UTC 26 August 2011 00 UTC 27 August 2011 00 UTC 23 August 2011
Ongoing work • Try the “opposite” experiment where the storm and its environment are moistened. • Dry/moisten outside of the storm or ahead of the storm. • Perform dry/moist experiments on a 3 km grid to analyze storm-scale convection.
Preliminary conclusions/future work • Distant vorticity perturbations have little impact on the ultimate track, intensity, and structure on the model forecasts. • Further testing is needed later in the model forecast, and with the TC vortex itself. • Moisture perturbations show a large amount of sensitivity.
References • Avila, Lixion A., and John Cangialosi, 2011: Hurricane Irene. Tropical Cyclone Report, 45 pp. • Hill, Kevin A., Gary M. Lackmann, 2009: Influence of Environmental Humidity on Tropical Cyclone Size. Mon. Wea. Rev., 137, 3294-3315. • Kain, John S., J. Michael Fritsch, 1990: A One-Dimensional Entraining/Detraining Plume Model and Its Application in Convective Parameterization. J. Atmos. Sci., 47, 2784–2802. • Komaromi, William A., Sharanya J. Majumdar, Eric D. Rappin, 2011: Diagnosing Initial Condition Sensitivity of Typhoon Sinlaku (2008) and Hurricane Ike (2008). Mon. Wea. Rev., 139, 3224–3242. • Lim, Kyo-Sun Sunny, Song-You Hong, 2010: Development of an Effective Double-Moment Cloud Microphysics Scheme with Prognostic Cloud Condensation Nuclei (CCN) for Weather and Climate Models. Mon. Wea. Rev., 138, 1587–1612. • Skamarock, W. C., J. B. Klemp, J. Dudhia, D. O. Gill, D. M. Barker, W. Wang, and J. G. Powers, 2005: A description of the advanced research WRF version 2. NCAR Tech. Note NCAR/TN-468+STR, 88 pp.
How are the perturbations generated?(Komaromi et al. 2011) • α is related to the amount of perturbation at distance from the center of the perturbation (r) at pressure attitude (p). R is the maximum radius of the perturbation, pbot and ptop are the bottom and top of the perturbation, respectively, and αmax is the maximum perturbation. • The new relative vorticity field (ζ1) is given as the sum of the original relative vorticity (ζ0) and the perturbation relative vorticity (ζ’). • The rebalanced streamfunction is obtained by using a successive over relaxation technique to invert the Laplacian: • Wind field derived from: , • Height: • Temperature: • Moisture perturbations are derived similarly, except that water vapor mixing ratio (q) is the perturbed quantity instead of relative vorticity. The height field is then rebalanced by re-computing virtual temperature and using the hypsometric equation, then the wind field is derived using geostrophy.