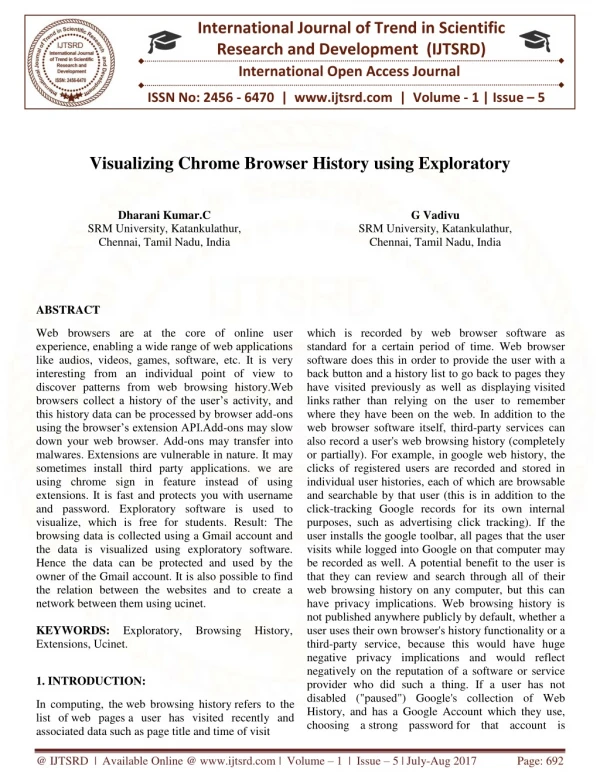
Visualizing Chrome Browser History using Exploratory
Web browsers are at the core of online user experience, enabling a wide range of web applications like audios, videos, games, software, etc. It is very interesting from an individual point of view to discover patterns from web browsing history.Web browsers collect a history of the user's activity, and this history data can be processed by browser add ons using the browser's extension API.Add ons may slow down your web browser. Add ons may transfer into malwares. Extensions are vulnerable in nature. It may sometimes install third party applications. we are using chrome sign in feature instead of using extensions. It is fast and protects you with username and password. Exploratory software is used to visualize, which is free for students. Result The browsing data is collected using a Gmail account and the data is visualized using exploratory software. Hence the data can be protected and used by the owner of the Gmail account. It is also possible to find the relation between the websites and to create a network between them using ucinet. Dharani Kumar.C | G.Vadivu "Visualizing Chrome Browser History using Exploratory" Published in International Journal of Trend in Scientific Research and Development (ijtsrd), ISSN: 2456-6470, Volume-1 | Issue-5 , August 2017, URL: https://www.ijtsrd.com/papers/ijtsrd2313.pdf Paper URL: http://www.ijtsrd.com/computer-science/artificial-intelligence/2313/visualizing-chrome-browser-history-using-exploratory/dharani-kumarc<br>

Visualizing Chrome Browser History using Exploratory
E N D
Presentation Transcript
International Journal of Trend in Scientific Research and Development (IJTSRD) International Open Access Journal ISSN No: 2456 - 6470 | www.ijtsrd.com | Volume - 1 | Issue – 5 Visualizing Chrome Browser History using Exploratory Dharani Kumar.C SRM University, Katankulathur, Chennai, Tamil Nadu, India ABSTRACT G Vadivu SRM University, Katankulathur, Chennai, Tamil Nadu, India Web browsers are at the core of online user experience, enabling a wide range of web applications like audios, videos, games, software, etc. It is very interesting from an individual point of view to discover patterns from web browsing history.Web browsers collect a history of the user’s activity, and this history data can be processed by browser add-ons using the browser’s extension API.Add-ons may slow down your web browser. Add-ons may transfer into malwares. Extensions are vulnerable in nature. It may sometimes install third party applications. we are using chrome sign in feature instead of using extensions. It is fast and protects you with username and password. Exploratory software is used to visualize, which is free for students. Result: The browsing data is collected using a Gmail account and the data is visualized using exploratory software. Hence the data can be protected and used by the owner of the Gmail account. It is also possible to find the relation between the websites and to create a network between them using ucinet. KEYWORDS: Exploratory, Browsing History, Extensions, Ucinet. which is recorded by web browser software as standard for a certain period of time. Web browser software does this in order to provide the user with a back button and a history list to go back to pages they have visited previously as well as displaying visited links rather than relying on the user to remember where they have been on the web. In addition to the web browser software itself, third-party services can also record a user's web browsing history (completely or partially). For example, in google web history, the clicks of registered users are recorded and stored in individual user histories, each of which are browsable and searchable by that user (this is in addition to the click-tracking Google records for its own internal purposes, such as advertising click tracking). If the user installs the google toolbar, all pages that the user visits while logged into Google on that computer may be recorded as well. A potential benefit to the user is that they can review and search through all of their web browsing history on any computer, but this can have privacy implications. Web browsing history is not published anywhere publicly by default, whether a user uses their own browser's history functionality or a third-party service, because this would have huge negative privacy implications and would reflect negatively on the reputation of a software or service provider who did such a thing. If a user has not disabled ("paused") Google's collection of Web History, and has a Google Account which they use, choosing a strong password for that account is 1. INTRODUCTION: In computing, the web browsing history refers to the list of web pages a user has visited recently and associated data such as page title and time of visit @ IJTSRD | Available Online @ www.ijtsrd.com | Volume – 1 | Issue – 5 | July-Aug 2017 Page: 692
International Journal of Trend in Scientific Research and Development (IJTSRD) ISSN: 2456-6470 2.2.1 METHODOLOGY: important to prevent hackers gaining access to confidential data. 2. LITERATURE REVIEW: 2.1 EXISTING SYSTEM: Sign in to chrome Download browser Google chrome extension is used to collect the data of browsing history. Once the extension is installed an icon appears right next t the address bar. If the user clicks the icon, it will extract the web history of the user and forms the weighted network. The user can see clusters of websites and could navigate to a website by clicking on the region allotted to it in tree map. The network of the web history is rebuilt with the latest data every time the user refreshes the page. Note that the clusters of most frequently visited websites tend to be placed towards the center of the bounding box making it easier for the user to navigate to those pages. history Upload it in exploratory 2.2 PROPOSED SYSTEM: Signing in to Chrome brings your bookmarks, history, and other settings to all your devices. Anything you update on one device instantly updates everywhere else, and your Chrome stuff is safe in case anything happens to your computer. It’s your web. Take it with you. So it is easy and safe to save data. We can also able to collect data from google using takeout google feature. Collect the data and save it in system. Upload the collected data in the exploratory software to visualize the browsing history. It is possible to create a network from the browsing history data using ucinet software. Visualizing the data Generate csv file Fig 1: Flow Diagram of the Method Used @ IJTSRD | Available Online @ www.ijtsrd.com | Volume – 1 | Issue – 5 | July-Aug 2017 Page: 693
International Journal of Trend in Scientific Research and Development (IJTSRD) ISSN: 2456-6470 Creating a network Upload it in ucinet 2.2.2. NETWORK DIAGRAM: FIG 1.2: NETWORK DIAGRAM USING UCINET 2.2.2.1 EGO NETWORK: Ego networks consist of a focal node ("ego") and the nodes to whom ego is directly connected to (these are called "alters") plus the ties, if any, among the alters. Of course, each alter in an ego network has his/her ownego network, and all ego networks interlock to form the human social network. @ IJTSRD | Available Online @ www.ijtsrd.com | Volume – 1 | Issue – 5 | July-Aug 2017 Page: 694
International Journal of Trend in Scientific Research and Development (IJTSRD) ISSN: 2456-6470 FIG 2: EGO BASED ON SINGLE USERID: FIG2.1: EGO BASED ON MULTIPLE USERID: BETWEENESS CENTRALITY: In graph theory, Betweeness centrality is a measure of centrality in a graph based on shortest paths. Betweeness can be calculated using ucinet software. @ IJTSRD | Available Online @ www.ijtsrd.com | Volume – 1 | Issue – 5 | July-Aug 2017 Page: 695
International Journal of Trend in Scientific Research and Development (IJTSRD) ISSN: 2456-6470 CALCULATING BETWEENESS USING UCINET: Un-normalized centralization: 53278.756 1 2 46 academiasrm 0.000 0.000 Betweeness 1196.125 60.410 293.902 14.844 153.448 7.750 64.820 3.274 17.448 0.881 5.917 4.248 nBetweeness 1 13 facebook 15 twitter 3 gmail 16 youtube 4 googleplus 27 freecharge 35 amazon 1.442 34 Flipkart 36 Ebay 37 myntra 14 yahoocricket 0.456 30 ticketsnew 28 bookmyshow 29 spicecinemas 19 tamilgunpro 39 javatpoint 17 dailymotion 2 googlemap 38 alvinalexander 33 hotstar 9 standfordedu 8 rdataminning 24 internshala 20 tamilrockers 21 tamilrockerz 22 starmusiq 18 tamilyogi 6 flowindata 7 rbloggers 31 miniclip 32 appfacebook 23 indianinternship 0.000 11 investopedia 12 analyticsiq 25 vfreshers 26 indianjobtalks 10 rproject 5 tatvic 40 javatut 41 scalatutorials 42 srmunivedu 43 evarsityresults 44 evarsitysrm 45 evarstiylogin google DESCRIPTIVE MEASURE: STATISTICS FOR EACH 0.299 0.215 0.073 0.073 0.066 0.056 0.023 0.010 0.010 0.010 0.007 0.007 0.007 0.007 0.007 0.003 0.000 0.000 0.000 0.000 0.000 0.000 0.000 0.000 0.000 0.000 0.000 0.000 0.000 0.000 0.000 0.000 0.000 0.000 0.000 0.000 0.000 0.000 0.000 0.000 1 2 Betweeness 1. 2. 3. 4. 5. 6. 7. 8. 9. 10. nBetweeness 1.442 1.313 1.099 Mean Std Dev 179.320 9.057 Sum 1743.000 Variance 32155.703 82.021 SSQ 1545206.875 MCSSQ 1479162.375 Euc Norm 1243.063 62.781 Minimum 0.000 Maximum 1196.125 60.410 N of Obs 46.000 37.891 1.914 88.030 0.206 0.206 0.206 0.144 0.129 0.129 0.129 0.129 0.063 0.000 0.000 0.000 0.000 0.000 0.000 0.000 0.000 0.000 0.000 0.000 3941.452 3772.989 0.000 46.000 Network Centralization Index = 59.80% 0.000 0.000 0.000 0.000 0.000 0.000 0.000 0.000 0.000 0.000 0.000 0.000 @ IJTSRD | Available Online @ www.ijtsrd.com | Volume – 1 | Issue – 5 | July-Aug 2017 Page: 696
International Journal of Trend in Scientific Research and Development (IJTSRD) ISSN: 2456-6470 FIG 3: OUTPUT FOR CENTRALITY MEASURE: 3. OUTPUT: FIG 4.1: SUMMARY OF THE DATA @ IJTSRD | Available Online @ www.ijtsrd.com | Volume – 1 | Issue – 5 | July-Aug 2017 Page: 697
International Journal of Trend in Scientific Research and Development (IJTSRD) ISSN: 2456-6470 FIG 4.2: SUMMARY OF THE DATA FIG 4.3: NUMBER OF TIMES VISITED @ IJTSRD | Available Online @ www.ijtsrd.com | Volume – 1 | Issue – 5 | July-Aug 2017 Page: 698
International Journal of Trend in Scientific Research and Development (IJTSRD) ISSN: 2456-6470 3.1 WEBSITES (EXAMPLES): 2005. IEEE Computer Society by Michael Balzer and Oliver Deussen. 5.Integrating Back, History and Bookmarks in Web Browsers by Kaasten S., Greenberg S. 6.An exploratory study of ego networks in an email network by Angel X. Chang, Computer Science Department Stanford University Stanford. 7.A set of measures of centrality based on betweenness" by L. C. Freeman 8.M. Everett and S. P. Borgatti. Ego network Betweeness. Socila Networks. 9.R Vidhya, G Vadivu, Research Document Search using Elastic Search, Indian Journal of Science and Technology 9 (37), 2016. 10.T. Y. J. Naga Malleswari , G. Vadivu, “Map reduce: A Technical Review”, Indian Journal of Science and Technology, Vol 9(1), January 2016. 11.Discovering Social Circles in Ego Networks by J. McAuley, J. Leskovec. ACM Transactions on Knowledge Discovery from Data (TKDD), 2014. 12.The Network Completion Problem: Inferring Missing Nodes and Edges in Networks by M. Kim, J. Leskovec. Conference on Data Mining (SDM) 2011. 13.K.Sornalakshmi, G.Vadivu, “A Survey on Realtime Analytics Framework for Smart Grid Energy Management”, International Journal of Innovative Research in Science, Engineering and Technology, March 2015. 14.M. Handcock, A. Raftery, and J. Tantrum. 2007a. Model-based clustering for social networks. Journal of the Royal Statistical Society Series A. 15.P. Krivitsky, M. Handcock, A. Raftery, and P. Hoff. 2009. Representing degree distributions, clustering, and homophily in social networks with latent cluster random effects models. Social Networks. 16.Hanneman, Robert A. and Mark Riddle. 2005. Introduction to social network methods. Riverside, CA: University of California, Riverside (published in digital form. 17.Navin, G. Vadivu, “Big Data Analytics for Gold Price Forecasting Based on Decision Tree Algorithm and Support Vector Regression (SVR)”, International Journal of Science and Research (IJSR), March 2015. 18.P. Borzymek, M. Sydow, and A. Wierzbicki, "Enriching trust prediction model in network with user rating similarity, " in Computational Aspects of Social Networks. IEEE, 2009, pp. 40-47. 1.https://takeout.google.com/settings/takeout 2.https://myaccount.google.com/privacy?pli=1 3.https://github.com/jimhester/gmailr 4.http://www.rdatamining.com/data 5.https://www.r-bloggers.com/an-example-of- social-network-analysis-with-r-using-package- igraph/ 6.http://web.stanford.edu/~messing/RforSNA.html 7.http://www.srmuniv.ac.in/ 8.http://www.srmuniv.ac.in/announcement/engg- tech-results 9.http://evarsity.srmuniv.ac.in/srmwebonline/exam/ onlineResult.jsp 10.https://www.tutorialspoint.com/java/java_object_c lasses.htm CONCLUSION: Hence visualizing the browsing history data using exploratory is achieved and Network diagram is used to find the relationship between the websites. Ego network based on single id and multiple id also achieved. Ucinet is used to find the Betweeness in the network. SIAM International ACKNOWLEDGMENTS: This research has been supported by ucinet, exploratory, chrome, Gmail. FUTURE ENHANCEMENT: In future we may try to use another web browser to get the browsing history data and visualizing it and finding the ego between the websites. REFERENCES: 1.Graphical Histories for Visualization: Supporting Analysis, Communication, and Evaluation by Jeffrey Heer, Jock D. Mackinlay, Chris Stolte, and ManeeshAgrawala. 2.Using Graphic History in Browsing the World Wide Web. Proc. World Wide Web by Ayers E.Z., Stasko J.T. 3.A Model and Framework for Visualization Exploration. IEEE Trans. on Visualization and Computer Graphics by Jankun-Kelly T.J., Ma K.- L., Gertz. 4.In INFOVIS 05: Proceedings of the Proceedings of the 2005 IEEE Symposium on Information Visualization, page 7, Washington, DC, USA, @ IJTSRD | Available Online @ www.ijtsrd.com | Volume – 1 | Issue – 5 | July-Aug 2017 Page: 699
International Journal of Trend in Scientific Research and Development (IJTSRD) ISSN: 2456-6470 19.Fusion based approach to discovering social circles in EGO networks A. Kamal ; M. M. LutfeElahi ; Bruce Poon ; M. Ashraful Amin. 20.G.Vadivu, Waheeta Hopper, “Ontology Mapping of Indian Medicinal Plants with Standardized Medical Terms”, Journal of Computer Science, ISSN 1549-3636., Aug, 2012. @ IJTSRD | Available Online @ www.ijtsrd.com | Volume – 1 | Issue – 5 | July-Aug 2017 Page: 700