Download

1 / 6
60 likes | 67 Views
There is need for good knowledge of soil permeability in order to estimate the quantity of fluid or water flow in soil, which will help in building and maintaining good road. The study sought to assess the permeability characteristics of Ado Ekiti to Ikere Ekiti road soil. Soil samples were taken from ten locations, subjected to permeability tests in Laboratory and the results analysed. Results showed that that the permeability values obtained from grain size and falling head methods varied from 1.73 x 10 6 u00c2u00acto 2.15 x 10 3 mm s and 8.46 x 10 2 u00c2u00acto 1.23 x 10 1 cm s respectively for all the soil samples. These showed that some soil samples have high permeability, while others have low permeability. Though all the soil samples were well graded. Thus, soil with high permeability portrayed high contents of granular materials sand , while that of low permeability portrayed high contents of clay and its minerals. There is need for further study. Adeyemi E. Adetoro | Samuel O. Akinlolu "Assessment of Permeability Characteristics of Ado-Ekiti to Ikere-Ekiti Road Soil, Southwestern Nigeria" Published in International Journal of Trend in Scientific Research and Development (ijtsrd), ISSN: 2456-6470, Volume-2 | Issue-5 , August 2018, URL: https://www.ijtsrd.com/papers/ijtsrd15737.pdf Paper URL: http://www.ijtsrd.com/engineering/civil-engineering/15737/assessment-of-permeability-characteristics-of-ado-ekiti-to-ikere-ekiti-road-soil-southwestern-nigeria/adeyemi-e-adetoro<br>

E N D
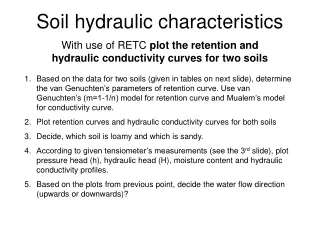
International Research Research and Development (IJTSRD) International Open Access Journal International Journal of Trend in Scientific Scientific (IJTSRD) International Open Access Journal ISSN No: 2456 ISSN No: 2456 - 6470 | www.ijtsrd.com | Volume 6470 | www.ijtsrd.com | Volume - 2 | Issue – 5 Assessment of Permeability Characteristics of Ado Ekiti Road Soil, Southwestern Nigeria Adeyemi E. Adetoro, Samuel O. Akinlolu Lecturer, Department of Civil Engineering, The Ado Ado – Ekiti, Nigeria, West Africa Assessment of Permeability Characteristics of Ado-Ekiti to Ikere Ekiti Road Soil, Southwestern Nigeria Adeyemi E. Adetoro, Samuel O. Akinlolu Department of Civil Engineering, The Federal Polytechnic, P.M.B. Ekiti to Ikere- Federal Polytechnic, P.M.B. [5] Expressed that the effect of water on the structural support of the pavement system depends upon saturated fine-grain roadbed soil, which could experience modulus reduction of more than 50%. Moreover, it portrayed that if the subgrade permeability is less than 3m/d some form of subsurface drainage or other design characteristics should be considered in order to combat potential moisture banes. Permeability is the property of a porous material, which allows the passage or seepage of water through its interconnecting void. permeability is defined as “the rate of discharge of water at 20o C under conditions of laminar flow through a unit cross-sectional area of a soil medium under a unit hydraulic gradient”. It is used to assess drainage characteristics of soil and predict rate of settlement founded on soil bed. pavement depends on the quality of its sub sub-base layers. As the foundation for the pavement’s upper layers, the sub-grade and sub key role in mitigating the detrimental effects of climate and the static and dynamic stresses generated by traffic. Therefore, building a stable sub properly drained sub-base is vital for constructing an effective and long lasting pav permeability of pavement layers in a typical road must be in descending order of subgrade > subbase > base ([4], [8]). In addition to stability and drainage requirements, the sub-grade and sub-base must be designed and constructed to exhibit a high level of spatial uniformity measured using engineering parameters. Several environmental variables (e.g. temperature, moisture etc.) must also be taken into account, since moisture etc.) must also be taken into account, since ABSTRACT There is need for good knowledge of soil permeability in order to estimate the quantity of fluid or in soil, which will help in building and maintaining good road. The study sought to assess the permeability characteristics of Ado-Ekiti to Ikere Ekiti road soil. Soil samples were taken from ten locations, subjected to Laboratory and the results analysed. Results showed that that the permeability values obtained from grain size and falling head methods varied from 1.73 x 10 ¬to 2.15 x 10⁻³ mm/s and 8.46 x 10⁻² ¬to 1.23 x 10 cm/s respectively for all the soil samples. Th showed that some soil samples have high permeability, while others have low permeability. Though all the soil samples were well- soil with high permeability portrayed high contents of granular materials (sand), while that of low permeability portrayed high contents of clay and its minerals. There is need for further study Keywords: Falling Head; Grain Size; Permeability; Road, Soil; Well-graded I. INTRODUCTION One of the most natural resources important to the existence of any facet of human life is water. However, throughout the world today, water is the main enemy of every road irrespective of the climate. This usually occurs when water rises through the capillaries into the road, consequentially, the road fails. When there are pressure and vibration of vehicles on this affected part of road, the soil becomes plastic [3]. The existence of linked voids that allow the flow of fluids when change in energy head occurs showed that soils are permeable materials. There is need for good knowledge of soil permeability in order to estimate the quantity of water or fluid flow in soil [8]. There is need for good knowledge of soil permeability in order to estimate the quantity of fluid or water flow in soil, which will help in building and maintaining good road. The study sought to assess the that the effect of water on the structural support of the pavement system depends upon grain roadbed soil, which could experience modulus reduction of more than 50%. Moreover, it portrayed that if the subgrade permeability is less than 3m/day (in wet climate), some form of subsurface drainage or other design characteristics should be considered in order to combat potential moisture banes. Ekiti to Ikere- Ekiti road soil. Soil samples were taken from ten locations, subjected to oratory and the results analysed. Results showed that that the permeability values obtained from grain size and falling head methods varied from 1.73 x 10⁻⁶ permeability permeability tests tests in in 2 ¬to 1.23 x 10⁻¹ Permeability is the property of a porous material, which allows the passage or seepage of water through its interconnecting void. permeability is defined as “the rate of discharge of C under conditions of laminar flow sectional area of a soil medium under a unit hydraulic gradient”. It is used to assess rainage characteristics of soil and predict rate of settlement founded on soil bed.The performance of a pavement depends on the quality of its sub-grade and base layers. As the foundation for the pavement’s grade and sub-base layers play a key role in mitigating the detrimental effects of climate and the static and dynamic stresses generated by traffic. Therefore, building a stable sub-grade and a base is vital for constructing an effective and long lasting pavement system. The permeability of pavement layers in a typical road must be in descending order of subgrade > subbase > base cm/s respectively for all the soil samples. These showed that some soil samples have high permeability, while others have low permeability. The The coefficient coefficient of of -graded. Thus, soil with high permeability portrayed high contents of granular materials (sand), while that of low ty portrayed high contents of clay and its minerals. There is need for further study. Falling Head; Grain Size; Permeability; One of the most natural resources important to the human life is water. However, throughout the world today, water is the main enemy of every road irrespective of the climate. This usually occurs when water rises through the capillaries into the road, consequentially, the road e and vibration of vehicles on this affected part of road, the soil becomes plastic [3]. The existence of linked voids that allow the flow of fluids when change in energy head occurs showed that soils are permeable materials. There is ge of soil permeability in order to estimate the quantity of water or fluid flow in soil In addition to stability and drainage requirements, the base must be designed and hibit a high level of spatial uniformity measured using engineering parameters. Several environmental variables (e.g. temperature, @ IJTSRD | Available Online @ www.ijtsrd.com @ IJTSRD | Available Online @ www.ijtsrd.com | Volume – 2 | Issue – 5 | Jul-Aug 2018 Aug 2018 Page: 715
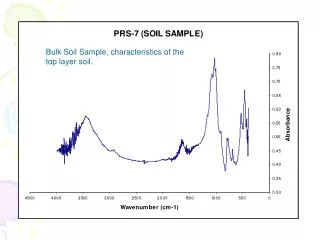
International Journal of Trend in Scientific Research and Development (IJTSRD) ISSN: 2456-6470 these variables have both short and long term effects on the geotechnical characteristics of the soil ([4], [8]). The effect of permeability on groundwater flow occurs when a rock that has high porosity is not permeable, if the pores or fractions are not connected. The larger and better shorted the particles, the more permeable rock or sediment tends to be. Effects of permeability characteristics on pavement layers performances generally depend on two interrelated characteristics namely load bearing capacity and volume changes. Load bearing capacity is often affected by degree of compaction, moisture content and soil type. While volume changes occur when pavement layers (i.e. base, sub base and sub grade) are exposed to excessive moisture or freezing conditions ([4], [8]). Permeability Tests are frequently used in the assessment of permeability in compacted soils in landfill and road construction. Soil permeability also known as “Hydraulic conductivity” is measured using many methods inclusive of Constant and Falling Heads laboratory tests on disturbed or undisturbed samples. During the test (s), there should be no volume change in the soil, there should be no compressible air present in the voids of soil i.e. soil should be completely saturated. The flow should be laminar and in a steady state condition. Permeability can be measured in the field using in-situ borehole permeability and field pumping tests. Another means is to experimentally permeability from the results of simple laboratory tests such as the Grain size distribution. Anyway, soil permeability had also been estimated using Cone penetration tests [8]. Many investigations carried out over the years for assessment of permeability characteristics of sub grade soil (which has been one of the criteria for road stability) indicated that there have been no accepted standard with reference to its characteristics performance thus bring about questions on its acceptability for highway construction [3]. The aim of this research work is to assess the permeability characteristics of Ado-ekiti to Ikere-ekiti road soil, South-western Nigeria. The test to be carried out is permeability test, which will help in determining the rate of flow of water/fluid in the road’s soil. These data would be useful to Engineers and other professionals. permeability was measured using laboratory falling head method. The measured permeability values were compared to the values experimentally derived from grain size distribution. Moreover, the coefficients of permeability were obtained using correlation based on the index soil properties of the tested soil for comparison with the measured values. A.Study Area The study area is along Ado Ekiti – Ikere Ekiti road connecting Ado – Ekiti and Ikere – Ekiti Local Government Areas (LGAs) together. It is about 14.4 km and lies within Latitude 70 301 7.5000 N and Longitude 50 141 5.2330 E as shown in fig. 1. Geologically, its landscape consists of ancient plains broken by steep sided outcropping dome rocks situated within tropical climate of Nigeria and underlain by metamorphic rocks of the Precambrian basement complex of Southwestern Nigeria, which are very ancient in age as shown in fig. 2. These basement complex rocks showed great variations in grain size and in mineral composition. The rocks are quartz gneisses and schists consisting essentially of quartz with small amounts of white mizageous minerals. In grain size and structure, the rocks vary from very coarse-grained pegmatite to medium- grained gneisses ([1], [2], [7]). The rocks are strongly foliated and occur as outcrops. The soils derived from the basement complex rock are mostly well drained, having medium to coarse in texture. The geological nature of the study area and its increased urbanisation make it more vulnerable and of public health concern when it comes to water quality ([1], [2], [7]). The coefficient of derive coefficients of @ IJTSRD | Available Online @ www.ijtsrd.com | Volume – 2 | Issue – 5 | Jul-Aug 2018 Page: 716
International Journal of Trend in Scientific Research and Development (IJTSRD) ISSN: International Journal of Trend in Scientific Research and Development (IJTSRD) ISSN: International Journal of Trend in Scientific Research and Development (IJTSRD) ISSN: 2456-6470 Figure 1: Location of the Study Area : Location of the Study Area- Ado-Ekiti to Ikere-Ekiti Road, Ekiti State, Nigeria Ekiti Road, Ekiti State, Nigeria Figure 2: Geology of the Study Area : Geology of the Study Area - Ado-Ekiti to Ikere-Ekiti Road, Ekiti State, Nigeria Road, Ekiti State, Nigeria II. MATERIALS AND METHODS A.Sample Collection and Analysis The whole stretch of the road was visually inspected and soil samples were taken from ten pits (i.e. locations) dug within the study area at interval of 500m and depth between 0.50m and 1.5m after topsoil removal using method of disturbed sampling. The soil samples collected were stored in polythene bag to maintain its natural moisture contents. The samples were then taken to the laboratory where the deleterious materials such as roots were removed. The samples were air dried, pulverized and large particle were removed. The coordinates of collected soil samples locations were taken using GPS. The details of the soil samples were as shown in Fig. 3 and Table 1. Moulding of test specimens was started as soon as possible after completion of identification. Th carried out on the samples were Grain Size carried out on the samples were Grain Size Distribution and Falling Head Permeability. All tests were performed in accordance with [6] standards and Distribution and Falling Head Permeability. All tests were performed in accordance with [6] standards and [5] specifications. The whole stretch of the road was visually inspected and soil samples were taken from ten pits (i.e. locations) dug within the study area at interval of 500m and depth between 0.50m and 1.5m after topsoil removal using method of disturbed sampling. The il samples collected were stored in polythene bag to maintain its natural moisture contents. The samples were then taken to the laboratory where the deleterious materials such as roots were removed. The samples were air dried, pulverized and large particles were removed. The coordinates of collected soil samples locations were taken using GPS. The details of the soil samples were as shown in Fig. 3 and Table 1. Moulding of test specimens was started as soon as possible after completion of identification. The tests Figure 3: Topographical Map of the Sampling locations : Topographical Map of the Sampling ns @ IJTSRD | Available Online @ www.ijtsrd.com Available Online @ www.ijtsrd.com | Volume – 2 | Issue – 5 | Jul-Aug 2018 Aug 2018 Page: 717
International Journal of Trend in Scientific Research and Development (IJTSRD) ISSN: 2456-6470 Coefficient of Uniformity (Cu) was calculated from Grain size grading curve using Hazen formula as shown in equation (1). Cu= D60/ D10 (1) Where D60 and D10 were obtained from the grading curve and it corresponds to the percentage passing at 60 percent and 10 percent respectively.in mm. When Cu>5, it indicates a well graded soil, while Cu<3 indicates a uniform soil. Permeability was calculated using McKinley formula as shown in equation (2). K = CD250 (2) Where K is permeability (mm/sec), C is McKinley’s constant which is approximately 0.00357 and D50 is maximum diameter of the smallest 50 percent of the sample. For the Falling (Variable) Head permeability test, permeability is expressed as: K = (2.303aL/A.T) Log10 (h1/h2) (3) Where K is the coefficient of permeability at T0C (cm/sec.). a is the cross-sectional area of stand pipe (cm2). L is the length of soil specimen (cm). A is the cross-sectional area of the soil specimen (cm2). T is the average value of t1 and t2, where t1 and t2 are the time interval for the head to fall from h1 to h2 (secs.). While h1 and h2 are the initial heads of water at times t1 and t2 in the pipe above the outlet (cm) respectively (cm). When K > 10-1 cm/sec., permeability is high, K = 10-1 cm/sec., it is medium and K < 10-1 cm/sec., it is low. Table 1: The details of the soil samples DESCRIPTION SAMPLE CODE S1 LOCATION COORDINATES Lat. 70 33’ 21”N Long. 50 12’ 50”E Lat. 70 32’ 36”N Long. 50 13’ 07”E Lat. 70 32’ 07”N Long. 50 13’ 13”E Lat. 70 31’ 35”N Long. 50 13’ 19”E Lat. 70 31’ 09”N Long. 50 13’ 24”E Lat. 70 33’ 39”N Long. 50 12’ 45”E Lat. 70 32’ 47”N Long. 50 13’ 03”E Lat. 70 31’ 54”N Long. 50 13’ 15”E Lat. 70 31’ 33”N Long. 50 13’ 12”E Lat. 70 31’ 10”N Long. 50 13’ 26”E 1 Sample from Bad portion of the Road near AP Filling Station S2 S3 S4 S5 S6 S7 S8 S9 S10 2 3 4 5 6 7 8 9 10 Sample from Bad portion of the Road inside bush along the Road Sample from Bad portion of the Road inside bush along the Road Sample from Bad portion of the Road inside bush along the Road Sample from Bad portion of the Road inside bush along the Road Sample from Good portion of the Road near APS Petrol Filling Station Sample from Good portion of the Road after Ado Road exit Sample from Good portion of the Road near OJS Oil Sample from Good portion of the Road near Midec Oil Sample from Good portion of the Road near Redeemed Church of God III. RESULTS AND DISCUSSION Table 2 shows the results of permeability and coefficient of uniformity using grain sizes for all the samples. The permeability values obtained ranges from 1.73 x 10⁻⁶ mm/sto 2.15 x 10⁻³ mm/s. These indicated that their permeability is very low (i.e. K < 10-1 cm/sec.), though well graded soil (i.e. Cu > 5). Low permeability shows that the soil in the study area retains water, which suggests that there is presence of large contents of clay / silt in the soil [9]. Thus, the soil becomes plastic under pressure from road surface, which might have resulted in pavement failure in some parts of the road. The permeability of the soil samples is in descending order of S1 > S9 > S4 > S5 > S7 > S8 > S10 > S3 > S6 > S2. @ IJTSRD | Available Online @ www.ijtsrd.com | Volume – 2 | Issue – 5 | Jul-Aug 2018 Page: 718
International Journal of Trend in Scientific Research and Development (IJTSRD) ISSN: 2456-6470 Table 2: Results of Coefficient of Uniformity (Cu) and Permeability (K) using Grain Size Distribution Sample D60 (mm) (mm) (mm) S1 0.50 0.004 128 0.250 S2 0.57 0.066 9 0.022 S3 0.25 0.006 45 0.100 S4 0.29 0.040 7 0.250 S5 0.28 0.040 7 0.200 S6 0.06 0.001 45 0.062 S7 0.23 0.008 31 0.190 S8 0.28 0.003 82 0.120 S9 0.74 0.002 493 0.310 S10 0.70 0.002 389 0.110 D250 (mm) 0.60250 2.15E-03 Well graded 0.00048 1.73E-06 Well graded 0.01000 3.57E-05 Well graded 0.06250 2.23E-04 Well graded 0.04000 1.43E-04 Well graded 0.00384 1.37E-05 Well graded 0.03610 1.29E-04 Well graded 0.01440 5.14E-05 Well graded 0.09610 3.43E-04 Well graded 0.01210 4.32E-05 Well graded D10 Cu D50 K Grading Type (mm/sec) Table 3 shows the results of permeability using Falling Head method for all the samples. The permeability values obtained ranges from 8.46 x 10⁻² cm/sto 1.23 x 10⁻¹ cm/s. These portrayed that their permeability ranges from low to high (i.e. K < 10-1; K > 10-1 cm/sec.). S2, S3, S4 and S5 soils have high permeability, which shows that they allow free flow of water through them. This suggested that there is presence of large contents of granular materials in the soils e.g. sand [9]. Part of road on these soils is liable to failure due to other Engineering factors. Additionally, their permeability is in descending order of S3 > S5 > S4 > S2. On the other hand, S1, S6, S10, S7, S9 and S8 have low permeability, which shows that they retain water and have presence of large contents of clay / silt materials. Road failure on these soils are likely to be as a result of high soil plasticity, though other Engineering factors are not ruled out. Their permeability is in descending order of S1 > S6 > S10 > S7 > S9 > S8. Table 3: Results of Permeability Test using Falling Head method Sample Head (h1) (h2) (Sec.) S1 110 50 2.63 7.51 S2 110 50 2.25 6.84 S3 110 50 2.54 6.48 S4 110 50 2.92 7.32 S5 110 50 2.77 6.92 S6 110 50 3.71 8.65 S7 110 50 3.54 8.92 S8 110 50 3.1 8.81 S9 110 50 3.55 9.22 S10 110 50 3.33 8.68 Generally, the results of the two methods of permeability used were at variance with each other. Grain size permeability method showed that all the soil samples have low permeability while Falling head permeability showed that the soil permeability ranges from low to high. Nevertheless, both methods agreed that S1, S6, S10, S7, S9 and S8 have low permeability. IV. Conclusion From the above study, some soil samples (i.e. S2, S3, S4 and S5) have high permeability, while others have Head t1 (Sec.) t2 T (t2-t1) (Sec.) Log10 (h1/h2) 0.34 0.34 0.34 0.34 0.34 0.34 0.34 0.34 0.34 0.34 K (cm/sec.) 9.89E-02 1.05E-01 1.23E-01 1.10E-01 1.16E-01 9.78E-02 8.98E-02 8.46E-02 8.52E-02 9.03E-02 4.88 4.59 3.94 4.40 4.15 4.94 5.38 5.71 5.67 5.35 low permeability. All the soil samples were well- graded i.e. good representative of soil types. The Falling head permeability method showed that the soil permeability ranges from low to high, which correlates with present condition of the road observed during field assessment. Permeability from Grain size method showed that all the soil samples have low permeability, which portrayed high contents of clay and its mineral in the soil of the study area. Thus, the soil retains water. The soil samples with high permeability portrayed high contents of granular materials (sand), which means allowance of free flow @ IJTSRD | Available Online @ www.ijtsrd.com | Volume – 2 | Issue – 5 | Jul-Aug 2018 Page: 719
International Journal of Trend in Scientific Research and Development (IJTSRD) ISSN: 2456-6470 of water in the soil. There is need for further study in order to ascertain the actual causes of road failure along the road. References 1.Adams, J.O. and Adetoro, A. E., “Quality Assessments of Water in Selected Waste – Dumping Site Areas,” International Journal of Scientific Research and Education, vol. 2(11), pp. 2399 – 2404, 2014b. Nigeria,” Polytechnic, Dept. of Civil Engineering: HND Dissertation (Unpublished), 2015. Nigeria, Ado-ekiti, The Federal 5.American Association of State Highway and Transportation Officials “Classification of Soil and Soil Aggregate Mixture for Highway Construction Purposes,” USA, Washington DC: AASHTO, Vol. 1, 2001. – AASHTO, 6.British Standard 1377 - BS 1377, “British Standard Methods of Test for Soils for Civil Engineering Purposes,” UK, London: British Standards Institution, 1990. 2.Adetoro, A. E. and Adams, J.O., “Analysis of Influences of Waste – Dumping Sites on the Quality of Water,” IOSR Journal of Mechanical and Civil Engineering (IOSR-JMCE), vol. 11(6 ver. IV), pp. 27 – 30, 2014. 7.Ekiti State Directorate of ICT, “The Official Website of the Government of Ekiti State, Nigeria,” https://ekitistate.gov.ng/administration/local-govt/, 30 May,, 2018. 3.Bayewu O. O., Olufemi S. T. and Adewoye, A. O., “Permeability Characteristics Subgrade Soil along Highway,” International Journal of Novel Research in Engineering and Applied Sciences (IJNREAS), vol. 2(1), pp. 1 – 7, 2013. of some 8.Elhakim, A. F. “Estimation of Soil Permeability,” Alexandria Engineering Journal, vol. 55, pp. 2631 – 2638, 2016. 9.Ola, Engineering,” Nigeria, Ibadan, Jericho: University Press Plc, 2013. S.A, “Essentials of Geotechnical 4.Ifada, P. T., Kasali, I. A., Makanjuola, P. I. and Monye, O. A. “Assessment of Permeability Characteristics of Sub-Grade Soil along Failed Sections of Ado-Ikere Road, South-Western @ IJTSRD | Available Online @ www.ijtsrd.com | Volume – 2 | Issue – 5 | Jul-Aug 2018 Page: 720