Download
1 / 9
90 likes | 114 Views
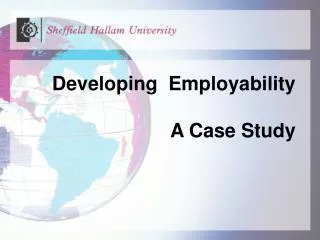
In recent years, the employability of students has become one of the main responsibilities of all university institutions. Universities have evolved from being inbred to begin to refer increasingly to society Universitat Politu00e9:cnica de Valencia, 2010 . The present research aims to evaluate the percentage of employability in administration students during their night shift. We used a reliability of 95 and a maximum allowed error of 5 . The study allowed to know that of the sample analyzed, 80.56 of the students already work likewise, 68.97 of the students who already work were thanks to the professional practices. Ramu00c3u00adrez Castau00c3u00b1eda Iscander A. | Velu00c3u00a1zquez Reyes Sara M. | Garcu00c3u00ada Carrillo Maru00c3u00ada C. "Analysis of Percentage of Employability, Case Study Licensee in Administration" Published in International Journal of Trend in Scientific Research and Development (ijtsrd), ISSN: 2456-6470, Volume-1 | Issue-5 , August 2017, URL: https://www.ijtsrd.com/papers/ijtsrd2226.pdf Paper URL: https://www.ijtsrd.com/other-scientific-research-area/other/2226/analysis-of-percentage-of-employability-case-study-licensee-in-administration/ramu00edrez-castau00f1eda-iscander-a<br>

E N D
International Journal of Trend in Scientific Research and Development (IJTSRD) UGC Approved International Open Access Journal ISSN No: 2456 - 6470 | www.ijtsrd.com | Volume - 1 | Issue – 5 Analysis of Percentage of Employability, Case Study Licensee in Administration Ramírez Castañeda Iscander A. Instituto Tecnológico de Tláhuac II Delegación Tláhuac, Ciudad de México, México Velázquez Reyes Sara M. Instituto Tecnológico de la Laguna Torreón, Coahuila, México García Carrillo María C. Instituto Tecnológico de la Laguna Torreón, Coahuila, México ABSTRACT In recent years, the employability of students has become one of the main responsibilities of all university institutions. Universities have evolved from being inbred to begin to refer increasingly to society (Universitat Politécnica de Valencia, 2010). The present research aims to evaluate the percentage of employability in administration students during their night shift. We used a reliability of 95% and a maximum allowed error of 5%. The study allowed to know that of the sample analyzed, 80.56% of the students already work; likewise, 68.97% of the students who already work were thanks to the professional practices. How feasible are Mexican university students? A necessary condition for employability, although not sufficient, is to have the minimum technical knowledge required to perform successfully in a job. According to the General Exams Exam of the Degree (EGEL) applied by Ceneval, between 45 and 50% of the graduates do not have the basic knowledge of their profession, so that for companies the quality of a graduate is practically one bet equivalent to a flop (Gómez, 2013).This, undoubtedly, plays against university students, because an entrepreneur who is adverse to risk will think twice before hiring a graduate who does not have enough information, Will require staff assessments or, where appropriate, costly training. According to the results of a survey conducted by Manpower Group, in Mexico 43% of employers expressed difficulties in filling vacancies, mainly because of the lack of available talent (Manpower Group, 2013).Employers are looking for people willing to grow and learn. 49% of the respondents showed that to overcome the shortage they must provide additional training and develop existing staff as the first option to fill vacancies. It is noteworthy that, according to the study, only 10% of employers in the region generate alliances with educational institutions to create training programs aligned with talent needs (Brockmann and Gonzalez, 2014). El Financiero (2013) mentions that, on the other hand, university enrollment shows a strong bias toward Keywords-- professional practices employability, administration, INTRODUCTION Brockmann and Gonzalez (2014) mention that by 2013, the federal government announced an increase in spending on science, technology and innovation of approximately 15% over that allocated in 2012, and a rising expenditure trend is expected for the year Which starts. Given the low economic growth and the conditions of budgetary restriction in national public finances, this effort is important to prioritize the development of a strategic item that allows Mexico to be placed at levels of investment similar to other countries of the Organization for Economic Cooperation and Development Development (OECD). Economic @ IJTSRD | Available Online @ www.ijtsrd.com | Volume – 1 | Issue – 5 Page: 53
International Journal of Trend in Scientific Research and Development (IJTSRD) ISSN: 2456-6470 service-oriented training, saturating that segment of the market and making it difficult for young people to work in these areas. Emphasizes the case of careers in administration, accounting and law (see Table); Although they have a significant demand on the part of the companies, this is insufficient in front of the number of applicants, which has an effect on the pressure of wages to the downside. In addition, a Mexican professional receives a monthly income of 10,313 pesos on average, which, according to the OECD, is only 10% higher than the salary of a worker who did not attend university. BACKGROUND Insurgentes University celebrates 20 years of existence in the educational field of Mexico City; however, its origins date back to 1976 when the Mexican Educational College was established with a response to the demand for commercial technical education, but since then its objective was to become a solid institution of higher education (Universidad Insurgentes, 2017). Congruent with its philosophy and mission and immersed in a dynamic of constant improvement, it has assumed throughout its trajectory innumerable challenges that have translated in work and dedication and at the same time in achievements and satisfaction; One of them is the experience of applying a system of self-recognition n (self-study) that involved the entire university community; This process was in itself an enriching lesson and even more the result: a large sum that is poured improvement(Universidad Insurgentes, 2017). This research will discuss the percentage of students currently working in their area of study. It will be based on a field study of the Insurgentes University Iztapalapa campus with the help of the students of the Night shift Administration area. It will handle a 95% of reliability in the investigation obtaining 68 results and with this obtaining a margin of 5% of error. With this approach was intended to answer some questions such as: What is the job position of the graduates of the Degree in Administration of the last three generations? In general, the purpose of this study is to know the type of employment in which the students of the Insurgentes University (UIN) of the Iztapalapa campus take turns belonging to the Administration area. It will identify the types of employment and functions they perform recognizing the reason for the decision making process to choose such career, as well as the reasons why they work there and what future they have in that job. The main purpose of this research is to expose the work situation of the students, since they sometimes only work to keep expenses of the School, socially it is an impulse for new generations, since they will be given information with which they will recognize the value of Work in your area to gain knowledge and get more skilled in the field. When applying the surveys in the University to the students of night shift of the degrees of Administration several results were thrown, the surveys were carried out with the sample of study, in annex will be shown an applied survey to reaffirm what already mentioned, the form used is constituted of 11 questions. In this way the analysis to be used for the following graphs were by means of percentages to reaffirm the main objectives. GENERAL OBJECTIVE To evaluate the percentage of employability of the students of the bachelor of Administration in their nocturnal shift. SPECIFIC OBJECTIVES Know the percentage of employability of management students. Analyze the percentage of employability of management students. Evaluate the results obtained from the analysis the percentage of employability of the administration students. CALCULATION OF THE SIMPLE Once the study population was known, the representative sample of the study was calculated. A 95% confidence interval and a maximum allowable error of 5% were used for the investigation. The formula used was the one proposed by Dr. Bolaños (2012), which is used for finite or known populations. The formula is as follows: N i ) 1 ( into institutional 2 * * * Z N p 2 q n 2 * * Z p q @ IJTSRD | Available Online @ www.ijtsrd.com | Volume – 1 | Issue – 5 Page: 54
International Journal of Trend in Scientific Research and Development (IJTSRD) ISSN: 2456-6470 Where: n : sample size N: population size Z: value corresponding to the gauss distribution, for the investigation Z = 95%, which is equal to 1.96. p: expected prevalence of the parameter to be evaluated, if not known (p = 0.5), which makes the sample size larger. q: 1 - p (if p = 70%, q = 30%) i: error expected to be committed if it is 5%, i = 0.05 The development of the formula is as follows: 5152 . 84 5 . 0 * 5 . 0 * ) 96 . 1 ( ) 1 88 ( ) 05 . 0 ( 6 The study noted that a population of 88 students with which the University counts, using 95% reliability and 5% error allowed, will require 72 students for research. ANALYSIS OF RESULTS Question 1 shows that 58 students in the study sample do work, while 14 students still do not work. Figure 1 shows an example of the information mentioned. 2 . 1 ( 96 ) * 88 5 . 0 * 5 . 0 * 5152 . 84 71 75 . 72 n 2 2 2175 . 0 9604 . 0 1779 . 1 AUDITORA AUTOMOTRI Z COLLCENTER COMERCIAL COMIDA COMPRA Y VENTA GOBIERNO 0% 2% 3%3%3% 80.56 3% 3% 3% CONTADOR 6% EDUCACION 6% ENTRETENIM IENTO VENTAS 19.44 20% 5% 3% 9% OTROS 1. Laboras actualmente si no 20% INMOBILIARI A TEXTIL 5% 5% Figure 1. Example of the results of question 1 In question 2, the type of company in which the students work is asked. The companies where the students work are conducting business activities and leading the administration of the organizations. Figure 2 shows an example of the information mentioned. SALUD FINANCIAMIE NTOS Figure 2. Example of the results of question 2 @ IJTSRD | Available Online @ www.ijtsrd.com | Volume – 1 | Issue – 5 Page: 55
International Journal of Trend in Scientific Research and Development (IJTSRD) ISSN: 2456-6470 Question 3 shows the result of the turn of the company where the students work for the degree of Administration. The turnover that obtained the highest percentage was manufacturing and production. Second is the turn of Information Technology and Financial Services and insurance. Third is the turn of trade. Figure 3 shows an example of the information mentioned. For question 4, you will know in which area the students who already work. 16% are sellers clearly from different areas of there with a percentage of 13% we find the administrative area, 11% we find heads of area and auxiliary accounting and 5% in accounting office. There are different areas in which they are used but with this graph we realize that the vast majority of the students who work are in areas important for their career 56% would be the percentage that the students are located is their area of the respective race that they have That is to say that more than half of the students who work are already in the respective area. Figure 4 shows an example of the information mentioned. 29.31 25.86 25.86 18.97 Figure 3. Example of the results of question 3 2% 8% ADMINISTRATIVA AUXILIAR CONTABLE VENDEDORES AUXILIAR DE AUDITOR CAJERA CONTABILIDAD ENCARGADO DE AREA JEFE LOGISTICA SUB GERENCIA OFICINISTA SUPERVISOR AYUDANTE EN GENERAL SASTRE 3% 13% 6% 2% 11% 8% 16% 11% 5% 9% 1% 5% Figure 4. Example of the results of question 4 In question 5, the majority of the students who already work have an average of one year working in the company. Second, students have less than a year in their work. Third, students have more than a year working in their jobs. Figure 5 shows an example of the information mentioned. @ IJTSRD | Available Online @ www.ijtsrd.com | Volume – 1 | Issue – 5 Page: 56
International Journal of Trend in Scientific Research and Development (IJTSRD) ISSN: 2456-6470 48.28 31.03 20.69 5. Tiempo de los servicios prestados actualmente menos de 1 año 1 año mas de un 1 año Figure 5. Example of the results of question 5 In question 6, the majority of students who already work, the main motivation for which they work is the opportunity they received after completing their professional practices. Second, the reason was because it was his first job. Third, the reason is that students like their work. Figure 6 shows an example of the information mentioned. 68.97 17.24 13.79 6. Motivo por el cual laboras en esa empresa Oportunidad después de las practicas Es mi primer trabajo Me gusta Figure 6. Example of the results of question 6 For question 7, the vast majority of students, no matter how important they are, are highly dissatisfied with their salary since more than 36 students receive their regular salary, less than 5 people mention that their salary is bad and Another part less than 25 people comment that their salary is good. With this the vast majority of students work to maintain their career regardless of whether the salary can be regular or bad. Regardless of this observation they have a chance to finish their career and be able to ascend in the company where they currently work. Figure 7 shows an example of the information mentioned. @ IJTSRD | Available Online @ www.ijtsrd.com | Volume – 1 | Issue – 5 Page: 57
International Journal of Trend in Scientific Research and Development (IJTSRD) ISSN: 2456-6470 TIPOS DE SUELDOS 40 35 30 25 20 15 10 5 0 BUENO REGULAR MALO Figure 7. Example of the results of question 7 In Question 8, 67% of working students have growth opportunity in the meantime this does not influence to stay in that company when they finish their career. They take into account the possibility of changing companies to improve their current salary no matter that more than 60% are with a good or regular salary. Figure 8 shows an example of the information mentioned. CRECIMIENTO LABORAL 33% CON APORTUNIDAD SIN OPORTUNIDAD 67% Figure 8. Example of the results of question 8 In question 9, most students who work, think of a future look for another workplace. Figure 9 shows an example of the information mentioned. @ IJTSRD | Available Online @ www.ijtsrd.com | Volume – 1 | Issue – 5 Page: 58
International Journal of Trend in Scientific Research and Development (IJTSRD) ISSN: 2456-6470 56.90 43.10 9. ¿Cuál es tu visión laboral al término de tu carrera? Seguir trabajando donde mismo Buscar otro lugar Figure 9. Example of the results of question 9. In question 10, the vast majority of the students who work said that their work vision revolves around the company in which they work. Figure 10 shows an example of the information mentioned. 56.90 43.10 10. Tu visión laboral antes mencionada gira entorno a tu empresa laboral Sí No Figure 10. Example of the results of question 10. In question 11, most students who work said that what they learned in college has helped them in their field of work. Figure 11 shows an example of the information mentioned. 72.41 27.59 11. Lo aprendido con la universidad te ha ayudado en tu campo laboral. Sí No Figure 11. Example of the results of question 11. @ IJTSRD | Available Online @ www.ijtsrd.com | Volume – 1 | Issue – 5 Page: 59
International Journal of Trend in Scientific Research and Development (IJTSRD) ISSN: 2456-6470 CONCLUSION In the applied surveys we find that of the 72 students 14 do not work and 58 yes, that is to say that more than 80.56% of the students are working. With this result will be possible to clarify all the objectives of the investigation. Also obtained information more than 60% of students work in an area related to their field of study and with them have a chance to stay in that company with a better salary and in a better position. A percentage of 30% is managed in an important area based on their area of study. This research recognizes that the vast majority of students work to maintain their study, just as it is recognized that the vast majority of students recognize that even if they have a chance of growth in their company they will not stay there if they do not look for better areas of work with better salaries. ACKNOWLEDGMENT M.I.I. Arturo González Torres por su asesoramiento, tutoría y dirección del proyecto. REFERENCES 1)Brockmann de Anda, C. y González Gómez, J. (2014). Empleabilidad y evaluación de la educación superior en México. Recuperado: http://archivo.estepais.com/site/2014/politicas-publicas-12/ 2)Gómez, N. (2013). 50% de egresados, sin el saber básico. El Universal. Recuperado: http://archivo.estepais.com/site/2014/politicas-publicas-12/#sthash.62z9PJjR.dpuf 3)Manpower Group. (2013). Encuesta sobre escasez de talento, resultados de la investigación. Manpower Group 4)El Financiero. (2013). Estudiantes mexicanos desertan cuando llegan a prepa. El Financiero. http://elfinanciero.com.mx/component/content/article/44-economia/19852-estudiantes-mexicanos- desertan-cuando-llegan-a-la-prepa.html. 5)Universitat Politécnica de Valencia. (2010). Estudios de empleabilidad de titulados de la UPV. Universitat Politécnica de Valencia. 6)Universidad Insurgentes. (2017). Universidad Insurgentes. Corporativo UIN. ANNEXED Carrera: _____________________________ Genero:________________ Edad:__________________ 1.Laboras actualmente Sí____________________________________ No__________________________________ 2.Empresa en la que laboras actualmente ______________________________________________________________________________ 3.Giro de la empresa _______________________________________________________________________________ @ IJTSRD | Available Online @ www.ijtsrd.com | Volume – 1 | Issue – 5 Page: 60
International Journal of Trend in Scientific Research and Development (IJTSRD) ISSN: 2456-6470 4.Puesto que desempeñas ________________________________________________________________________________ 5.Tiempo de los servicios prestados actualmente ________________________________________________________________________________ 6.Motivo por el cual laboras en esa empresa ________________________________________________________________________________ 7.El tipo de sueldo que percibes es: Bueno_____________________ Regular______________________ Malo____________________ 8.Oportunidad de crecimiento para tu área de trabajo ________________________________________________________________________________ 9.¿Cuál es tu visión laboral al término de tu carrera? ________________________________________________________________________________ 10.Tu visión laboral antes mencionada gira entorno a tu empresa laboral Sí_______________________________________ No________________________________________ 11.Lo aprendido con la universidad te ha ayudado en tu campo laboral. Sí_______________________________________ No________________________________________ @ IJTSRD | Available Online @ www.ijtsrd.com | Volume – 1 | Issue – 5 Page: 61