Download
1 / 152
1.52k likes | 1.72k Views
Building a SEM Organization as a Data Driven Consultant. Jay W. Goff, Vice Provost and Dean for Enrollment Management Missouri University of Science & Technology ACAP Annual Conference, Memphis, TN March 16, 2009. OVERVIEW.

E N D
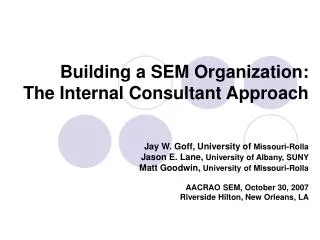
Building a SEM Organization as a Data Driven Consultant Jay W. Goff, Vice Provost and Dean for Enrollment Management Missouri University of Science & Technology ACAP Annual Conference, Memphis, TN March 16, 2009
OVERVIEW • SEM Primer & Positioning: the In-House Consultant (IHC) Performance Paradigm • Environmental Scan • SEM Strategies • Implementing the IHC SEM Platform with the Entire Campus • Preparing to be an IHC SEM professional • Creating the SEM Plan with the IHC positioning perspective
Learn More about SEM & Effective Retention Strategies • Retention 2009: An International Conference on Student Retention May 27-29, 2009, New Orleans, LA www.educationalpolicy.org • SEM: AACRAO’s 19th annual Strategic Enrollment Management Conference November 9-11, 2009, Dallas, TX www.aacrao.org/sem19
The only person who likes change is a wet baby. Attributed to Mark Twain
What is SEM? • Strategic Enrollment Management (SEM) is defined as “a comprehensive process designed to help an institution achieve and maintain the optimum recruitment, retention, and graduation rates of students where ‘optimum’ is designed within the academic context of the institution. As such, SEM is an institution-wide process that embraces virtually every aspect of an institution’s function and culture.” Michael Dolence, AACRAO SEM 2001 • Research • Recruitment • Retention
The External Environment in which Colleges and Universities Operate is Changing Quickly • Dramatic changes in student markets. • Public expectations for a wide variety of high quality student services. • Greater needs for an institution-wide understanding of how to best react to the emerging student trends, needs and markets.
Today’s Enrollment Manager • “Successful senior enrollment managers have to operate simultaneously on multiple levels. They need to be up to date, even on the cutting edge of technology, marketing, recruitment, the latest campus practices to enhance student persistence, and financial aid practices.” SOURCE: THE ENROLLMENT MANAGEMENT REVIEW Volume 23, Issue 1 Fall, 2007, Editor: Don Hossler Associate Editors: Larry Hoezee and Dan Rogalski
Hossler continued • “(Enrollment Managers) need to be able to guide and use research to inform institutional practices and strategies. Successful enrollment managers need to be good leaders, managers, and strategic thinkers. • They have to have a thorough understanding of the institutions where they work and a realistic assessment of the competitive position in which it resides and the niche within which it can realistically aspire to compete. Furthermore, to be effective, enrollment managers must also have a sense of how public, societal, and competitive forces are likely to move enrollment-related policies and practices in the future.” SOURCE: THE ENROLLMENT MANAGEMENT REVIEW Volume 23, Issue 1 Fall, 2007, Editor: Don Hossler Associate Editors: Larry Hoezee and Dan Rogalski
Embracing Consulting Expectations Similarities between external consultants and current expectations of SEM professionals is only one step in embracing the IHC approach. • Both Structure and Orientation are important • Philosophical orientation (e.g., administrative, student focused, academic, or market-centered) can impact how the SEM units operate • Due to the manner in which universities actually work, neither structure nor orientation fully optimizes the SEM units’ impact on the overall function of the university if the POSITIONING of SEM processes and its leaders are not commonly appreciated and valued.
What is Missouri S&T? • A Top 50 Technological Research University • 6100 students: 4700 Undergrad, 1400 Graduate • 90% majoring in Engineering, Science, Comp. Sci. • Ave. Student ACT/SAT: upper 10% in nation • +60% of Freshmen from upper 20% of HS class • 20% Out of State Enrollment • 96% 5 Year Average Placement Rate within 3 months of Grad • Ave. Starting Salary in 2007: +$53,000
SEM in ACTION: Why Change the University Name? “Missouri S&T will better define the university as a leading technological research university. We believe the new name will help to differentiate this university in a highly competitive university market and provide a national competitive advantage.” Dr. John F. Carney, III Missouri S&T Chancellor
7 Years of Strategic and Dramatic Changes January 1, 2008 University Name Change 2007 Academic Reorganization by Eliminating Schools and Colleges 2003 and 2007 Updated the Mission, Vision and Strategic plans. 2004 Office of Technology Transfer and Economic Development 2001 to 2005 New Student and Business Information Systems 2002, 2004 & 2007 Three New Homepages and Platforms 2003 Student Diversity Initiative The new goals resulted in three new units and champions: • Student Diversity Programs, • Women’s Leadership Institute • Center for Pre-College Programs. 2002 New School of Management and Information Sciences 2002 Center for Education Research and Teaching Innovation (CERTI) 2002 - 2006 12 NEW Degree Programs and 19 Certificate Programs, 128 hour limited for BS Engineering Degrees 2001 Administrative Restructuring and Formal Enrollment Management Program • Enrollment Management, • Distance and Continuing Education • Research and Sponsored Programs • Undergraduate and Graduate Programs
SEM at Missouri S&T 2001-2009 RECORD GROWTH DECLINING INTEREST “Succeeding while Swimming Against the Tide”
RI 1 - 9 students No students 49 Fall 2008 1 5 Legend 7 2 2 21 40 or more students 4 3 15 12 16 10 - 39 students 1 2 15 5 26 11 43 5 21 14 1 430 2 16 22 5 2 DC 58 4,433 124 17 16 9 23 21 Total Enrollment • 47 states & 51 nations • 70% Missouri residents • 10% minority students • 9% international students 54 61 2 6 11 19 16 115 9 3 12
Fall 2008 All Students by Academic Field Missouri S&T: 90% Engineering, Science, & Computing Majors 21st in Nation for Largest Undergraduate Engineering Enrollment (Prism 2008) 23rd in Nation for Number of BS Engineering Degrees Granted (Prism 2009)
Undergraduate Demographics Average Age: 21.6 years old Gender: 23% Female 77% Male First Generation College Students: 2005-06: 37% Residency: Missouri Residents: 76% Out-State Students: 22% International: 2% Ethnicity: African-American: 4% Asian-American: 3% Caucasian: 83% Hispanic: 2% Native-American: 1% Non-resident, International: 2% Not Disclosed: 5% From a Community <40,000: 55% approx. Average Family Income: $72,000 Average Indebtedness at Graduation: $21,000 USD approx. High Financial Need (Pell qualifier): 24% Freshmen with Credit Cards: 24% 6 arrive with over $1000 USD standing balance Students with PCs: 94% +70% laptops 7% Macs Students with Cell Phones 97%
STUDENT RETENTION Graduation Rates 20002005 General Student Body: 52% 64%
Goal 2.1: Status UpdateGrow overall enrollment to 6,550 by 2012 with diversity that reflects the State of Missouri and the global environment in which we compete. Increase the overall graduate enrollment to 1,750.
The ideal Missouri S&T freshmen class would have 990 to 1030 students with the following profile: Academic Preparedness: 27 average ACT score (upper 10% in nation) 90% having completed the full Missouri college-prep curriculum 50% from the upper 20% of high school class Geography: 70% in-state 25% out-of-state 5% international Gender: 30% female 70% male Ethnicity: 13% under-represented minority students Majors: 70% Engineering (all programs) 5% Liberal Arts (psychology, history, English, technical communication, philosophy) 8% Business, Information Technology and Economics 9% Natural Sciences and Mathematics (biology, chemistry, physics) 8% Computer Science Success Rate: 90% first to second year retention rate 80% return for third year 65-70% graduate in six years
Life as a National Outlier Average enrollment is 6,457 Average enrollment is 5,615
Ongoing interest declines in key fields Changes in Intended Major 1976-77 to 2006-07 DATA SOURCE: CIRP CHART SOURCE: College Board, 2007
> 5% SOURCE: ACT EIS 2008
Missouri’s 2008 Student Funnel for All Engineering Fields • High School Senior : 72,467 • High School Graduates: 61,752 • ACT Testers/College Bound: 47,240 • Any Engineering Interest (all testers): 1,768 • Any Engineering Interest, (+21 testers): 1,256 (21 = MO average score / 50%) • Engineering Interest, +24 comp. score: 961 (24 = UM minimum for auto admission) • Missouri S&T Freshmen Engineering Enrollees: 681 SOURCES: MODESE 2009, ACT EIS 2008, PeopleSoft
Minimal Markets for Female & Minority EngineersMissouri’s 2008 ACT Tested Seniors, +24 ACT and Interested in Engineering • High School Senior Cohort: 72,467 • High School Graduates: 61,752 • All Engineering Interest, +24 comp. score: 961 (24 = UM minimum for auto admission) • Female Engineering, +24 comp. score: 176 • African-Amer Engineering, +24 comp. score: 21 • Asian-Amer Engineering, +24 comp. score: 25 • Native Amer Engineering, +24 comp. score: 7 • Hispanic Engineering, +24 comp. score: 24
Silver Bullet OR Strike of Lightening?
Strategic Enrollment Management Plan 2007-2011 Increase Success of Students Retention Rates Graduation Rates Increase College Going Rate & Access Access & Affordability Pipeline of College Ready Students Strategic Partnerships Outreach/Education Scholarships Expanding Current Markets & Capturing New Markets Out-of-state students Transfer Students Female Students Underrepresented Minority Students International Students Graduate Students Nontraditional Students
We Learned About Our Students Average Age: 21.8 years old Gender: 23% Female 77% Male First Generation College Students: 2005-06: 37% Residency: Missouri Residents: 76% Out-State Students: 22% International: 2% Ethnicity: African-American: 4% Asian-American: 3% Caucasian: 83% Hispanic: 2% Native-American: 1% Non-resident, International: 2% Not Disclosed: 5% From a Community <40,000: 53% Average Family Income: $73,000 USD Average Indebtedness at Graduation: $21,000 USD approx. High Financial Need (Pell qualifier): 24% Freshmen with Credit Cards: 24% 6 arrive with over $1000 USD standing balance Students with PCs: 94% +70% laptops 9% Macs Students with Cell Phones 97%
PROMOTE OUTCOMES: Starting Salaries UndergraduateGraduate 2003 $ 47,305 $ 52,744 2004 $ 46,567 $ 52,945 2005 $ 49,181 $ 53,042 2006 $ 51,059 $ 58,120 2007 $ 53,669 $ 62,751 2008 $ 55,975 $ 63,640
10 Core Recruitment Changes • Creation of Data and Market Driven Strategic Plan • Assigning Executive Officers to be in Charge of Enrollment, Recruitment, Retention, and Student Assessment • Embracing an Integrated Branding Program and New Communication Series focusing on Outcomes and Fun, without reinforcing science and engineering stereotypes • Engaging the entire campus (unit by unit) in worthwhile recruiting activities • Creation of Reward Balanced and Yield Focused Scholarship Program to Lower the Discount Rate, Raise Enrollment, and Maintain Student Quality • Providing accurate and timely processing of inquiry requests and applications • Collaborating with Outreach and Public Relations Efforts • Expanding Campus Visit and Summer Camps • Campus Signage, Beautification and Landscaping Plan • Replacing and Updating Core Campus Buildings and Facilities ($140 M)
STUDENT RETENTION Since 2004, 60% of Growth due to Retention Increase Graduation Rates 20002005 General Student Body: 52% 64%
“the list of 35”Changes to Improve RetentionRetention Strategies and Tactics 2001-2008 I. Assessment EnhancementsII. ProgrammingIII. Policy Changes
Creation of a formal Institutional Research Office, 2001 Started annual retention audit of academic (cognitive) and demographic factors, 2001 Identified classes with very low student success rates (DFW), 2001 Creation of Standardized Retention and Graduation Reports by gender and ethnicity, 2002 Instituted a new student profile and expectations survey, 2002 Re-instituted the HPI assessment to track students by Non-cognitive factors, 2002 Revised withdraw surveys & interviews, 2002 Started non-returning follow-up telephone surveys, 2002 Started collection and campus-wide distribution of freshman academic profile, specifically new student survey data: expectations, social activities, GPA,ACT/SAT scores, 2002 Started measuring stop-out rate: students who withdraw and return, 2003 Revised nationally normed student profile, attitude and engagement assessments (CIRP & NSSE), 2003 Revived student satisfaction survey (switched from ACT to Noel Levitz), 2007-08 Missouri S&T’s Retention Plan I. ASSESSMENT ENHANCEMENTS
II. PROGRAMMING: Focus on Advising, tutoring, learning communities, faculty training and support Provided a public expectation of student success (VERY IMPORTANT). Addressed expectations of student success in all recruitment and orientation speeches (Chancellor – look to your left, look to your right), 2001-02 Learning Enhancement Across Disciplines (LEAD) tutoring program expanded beyond Physics, Fall 2002 Address group building (making friends) and study skills (not flunking out) in all orientation activities, 2002-2003 Online tutor request program, 2003 Distribution of student profiles and survey summaries to create a better understanding of faculty and student expectations. Actively embrace the “social norming” concept. 2003 Distribution of student profiles and survey summaries to create a better understanding of faculty and student expectations. Actively embrace the “social norming” concept. 2003 Restructured Opening Week activities around a group project activity and to address core learning objectives and student fears (Making Friends and Flunking Out) , 2002 & 2003 Provided ACT’s EIS & AIM student profile data bases to all academic departments for more intrusive advising, 2003 Joint Academic Management (JAM) Sessions (student to student tutoring) to assist low performing students, 2004
II. Programming Continued New on-line Early Warning System, 2005 Strategic Retention Intervention: Focus on a rapid response “Academic Alert System” (2005), on-line student communication system “Success Chain” (2005-2006), advisor engagement (training sessions and awards, 2002) and more quantitative knowledge of S&T student strengths (Sharing of student profiles and new student survey data prior to beginning of academic year, 2002) Creation and expansion of Learning Communities & First Year Experience Programs: Focus to address student academic skills development and social engagement through group student life oriented events, 2002-2003 Pre-College Transition Programs: Focus to promote greater student preparation to meet student and S&T academic expectations through a 3-week intense course – Hit the Ground Running (HGR) and creation of the Center for Pre-College Programs (CPCP) to expand the K-12 student workshops and STEM summer camps, 2003-04 Creation of the Center for Educational Research and Teaching Innovation (CERTI): Focus to address improving the S&T learning environment and student learning outcomes through collaborative learning, experiential learning, technology enhanced learning and educational research practices, 2003-04 Expanded Experiential Learning Programs: Focus to promote greater campus-wide “learning by doing” student engagement through student design teams, undergraduate research (OURE expansion), and service learning participation, 2002-ongoing Creation of formal first-year experience office and staff, 2008 Creation of formal second-year experience office and staff, 2008
III. POLICY CHANGES Incomplete grade time limit change, 2002 Repeat course GPA adjustment policy, 2002 Scholarship Reinstatement Policy, 2002 All BS degree programs reduced to between 124 to 128 hours, 2002-2003 Added 3 degree programs most often requested by exiting students: Business, IST, Technical Communication, Architectural Engineering, 2002-2003 Revised S&T Advising Program: Focus on faculty development for student formal and developmental advising, advisor recognition and advising program evaluation, 2002-2004
BREAK - SESSION II • Implementing the IHC SEM Platform with the Entire Campus • Preparing to be an IHC SEM professional • Creating the SEM Plan with the IHC positioning perspective
What is SEM? • Strategic Enrollment Management (SEM) is defined as “a comprehensive process designed to help an institution achieve and maintain the optimum recruitment, retention, and graduation rates of students where ‘optimum’ is designed within the academic context of the institution. As such, SEM is an institution-wide process that embraces virtually every aspect of an institution’s function and culture.” Michael Dolence, AACRAO SEM 2001 • Research • Recruitment • Retention
The IHC Orientation to SEM Institutions embracing SEM must start with: • Organizational Structure • Philosophical Orientation (Academic vs. Student Affairs) • IHC Positioning cannot happen until the first two are established.
Review: In-House Consulting SEM Model IHC approach provides: • a rhetorical strategy of providing help to all constituents • a values-based training philosophy, • an institutional expectation for collaboration • a push for a heightened sense of professionalism. • continuity – the consultant does not leave!
The IHC Orientation to SEM Institutions embracing SEM must start with: • Organizational Structure • Philosophical Orientation (Academic vs. Student Affairs) • IHC Positioning cannot happen until the first two are established.
IHC: the POWER of Metaphor SEM professionals could be more effective if the campus community views them in a “consultant” or helping role, rather than just “another administrator” running a support unit. Positioning SEM professional as an In-House Consultant signals: • campus leaders are serious about meeting the institution’s enrollment goals • A willingness to take steps necessary to support a SEM-based organization.
SEM Fundamentals • Strategic Planning • Context of Setting Enrollment Goals • Alignment with the College’s/University’s Vision, Mission, Values, and Goals • Factors of Enrollment Planning • Enhancing the Educational Experience for Students