Download
1 / 21
210 likes | 233 Views
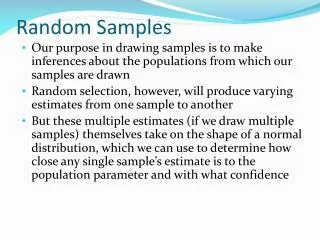
Explore the power of stratified sampling in increasing precision by dividing the population into strata, optimizing sample sizes, and enhancing estimation accuracy. Learn to design efficient sampling strategies for better statistical outcomes.

E N D
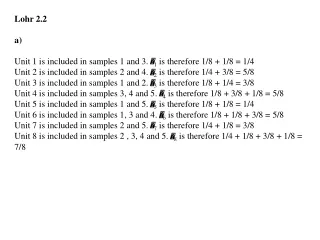
Lohr 2.2 a) Unit 1 is included in samples 1 and 3. 1 is therefore 1/8 + 1/8 = 1/4 Unit 2 is included in samples 2 and 4. 2 is therefore 1/4 + 3/8 = 5/8 Unit 3 is included in samples 1 and 2. 3 is therefore 1/8 + 1/4 = 3/8 Unit 4 is included in samples 3, 4 and 5. 4 is therefore 1/8 + 3/8 + 1/8 = 5/8 Unit 5 is included in samples 1 and 5. 5 is therefore 1/8 + 1/8 = 1/4 Unit 6 is included in samples 1, 3 and 4. 6 is therefore 1/8 + 1/8 + 3/8 = 5/8 Unit 7 is included in samples 2 and 5. 7 is therefore 1/4 + 1/8 = 3/8 Unit 8 is included in samples 2 , 3, 4 and 5. 8 is therefore 1/4 + 1/8 + 3/8 + 1/8 = 7/8
b) Thus, the sampling distribution is
Lohr 2.6 a) b)
Stratified sampling • Population divided into strata (one stratum). [Males and Females; Different regions; Age classes, etc.]. Stratum sizes N1, N2, … , NH • Sampling made form each stratum to account for different variation within different strata Increases precision. Sample sizes n1, n2, … , nH • Estimation of population totals and population means (proportions) by weighing sample means from all strata. Weights computed from relative stratum sizes • (Nh / N ) • Design planning: Select the total sample size based on precision requirements (typically length of confidence intervals). Allocate the sample units over strata – proportional allocation (only size-based), optimal allocation (size-, variation- and cost-based).
Lohr 3.2 a)
b) There are 36 combinations of samples but only 12 combinations with unique values of total estimates
Lohr 3.7 a)
b) To compare with the results from 2.6 b divide both estimates with N:
c) • In 2.6 d) the standard error of the corresponding estimated proportiomn was 0.0687. Thus, the precsion has been reduced a bit. • A corresponding confidence interval here gets the error margin • compared to 0.135 of 2.6 d)
Lohr 3.22 a)
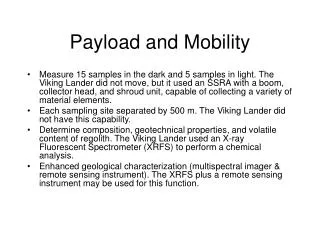
Cluster sampling • Population divided into heterogeneous groups - clusters, each serving as a mirror of the whole population [communities, living areas, schools, classes within a school] • Clusters are not the same as strata. Care should be taken so that two clusters by definition do not have different population properties. • Cluster sampling is a tool for economising the sampling. Precisions of estimates are usually worse than for simple random sampling (SRS) of observation units. • Cluster sampling can be made as one-stage, two-stage or multi-stage sampling. primary units [highest level, e.g. communities], secondary units [e.g. living areas], tertiary units [e.g. individuals]
Clusters can be of equal or non-equal sizes [different formulas for estimators] • Sampling at different stages can be made differently – with equal or unequal (Ch. 6) probabilities • Stratified sampling can be involved. E.g. If communities are clusters we still may consider individuals in owned homes to have different living habits than individuals in rented homes. Thus we may stratify within communities. • National surveys are almost always made with cluster sampling in a complex fashion. • Formulas are always more complicated, due to the more complex structure of the sampling – Cost is lower.
Lohr 5.11 Claims are primary units, fields are secondary units. 215 (interesting) fields in each claim Clusters with equal sizes, M =215 One-stage sampling: SRS of primary units, checking all secondary units within a sampled primary unit.
a) b)