Download
1 / 66
660 likes | 716 Views
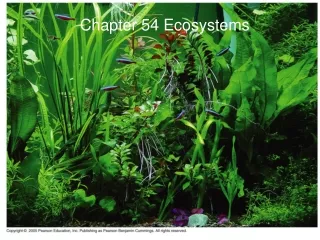
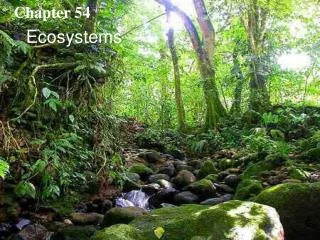
Chapter 54. Ecosystems. An ecosystem consists of all the organisms living in a community + the abiotic factors with which they interact. Ecosystems can range from a microcosm, e.g. aquarium to a large area e.g. a lake or forest. Figure 54.1.

E N D
Chapter 54 • Ecosystems
An ecosystem consists of all the organisms living in a community + the abiotic factors with which they interact
Ecosystems can range from a microcosm, e.g. aquarium to a large area e.g. a lake or forest Figure 54.1
2 main processes: energy flow and chemical cycling • Energy flows through ecosystems • While matter cycles within them
Ecosystems and Physical Laws • Energy is conserved • But degraded to heat during ecosystem processes
Trophic Relationships • Energy and nutrients pass from primary producers (autotrophs) primary consumers (herbivores) secondary consumers (carnivores)
Tertiary consumers Microorganisms and other detritivores Secondary consumers Primary consumers Detritus Primary producers Heat Key Chemical cycling Sun Energy flow Figure 54.2 • Energy flows through an ecosystem • Entering as light and exiting as heat
Figure 54.3 Detritivores, (bacteria and fungi) • Recycle essential chemical elementsby decomposing organic material and returning elements to inorganic reservoirs
Primary production • amount of light energy converted to chemical energy by autotrophs
Ecosystem Energy Budgets • Photosynthetic production sets the spending limit for the energy budget of the entire ecosystem
The Global Energy Budget • Amount of solar radiation reaching the surface of the Earth limits the photosynthetic output of ecosystems • Only a small fraction of solar energy actually strikes photosynthetic organisms
Gross Production (GPP) • Total primary production in an ecosystem
Net primary production (NPP) • GPP minus the energy used by the primary producers for respiration • Only NPP is available to consumers
Open ocean 125 24.4 65.0 360 Continental shelf 5.2 5.6 1,500 Estuary 0.3 1.2 Algal beds and reefs 2,500 0.1 0.9 Upwelling zones 0.1 500 0.1 Extreme desert, rock, sand, ice 3.0 4.7 0.04 0.9 90 Desert and semidesert scrub 3.5 Tropical rain forest 2,200 22 3.3 2.9 Savanna 900 7.9 9.1 2.7 Cultivated land 600 Boreal forest (taiga) 9.6 2.4 800 1.8 Temperate grassland 600 5.4 Woodland and shrubland 700 1.7 3.5 Tundra 0.6 1.6 140 Tropical seasonal forest 1,600 7.1 1.5 Temperate deciduous forest 1,200 1.3 4.9 1,300 Temperate evergreen forest 1.0 3.8 Swamp and marsh 0.4 2,000 2.3 Lake and stream 0.4 250 0.3 0 10 20 30 40 50 60 0 500 1,000 1,500 2,000 2,500 0 5 10 15 20 25 Key Average net primary production (g/m2/yr) Percentage of Earth’s surface area (a) (b) Percentage of Earth’s net primary production Marine Terrestrial Figure 54.4a–c Freshwater (on continents) Net primary production (c)
North Pole 60N 30N Equator 30S 60S South Pole 120W 180 0 60E 120E 180 60W Figure 54.5 • Terrestrial ecosystems contribute about two-thirds of global NPP and marine ecosystems about one-third
Primary Production in Marine and Freshwater Ecosystems • Both light and nutrients control primary production
Light Limitation • The depth of light penetration affects primary production
Nutrient Limitation • Limit primary production more than light
Limiting nutrient • Element that must be added in order for production to increase • Nitrogen and phosphorous typically the nutrients that most often limit marine production
EXPERIMENT Pollution from duck farms concentrated near Moriches Bay adds both nitrogen and phosphorus to the coastal water off Long Island. Researchers cultured the phytoplankton Nannochloris atomus with water collected from several bays. 30 21 Long Island 19 Shinnecock Bay 15 5 11 4 Moriches Bay Great South Bay Atlantic Ocean Coast of Long Island, New York.The numbers on the map indicate the data collection stations. 2 Figure 54.6 • Nutrient enrichment experiments
RESULTS Phytoplankton abundance parallels the abundance of phosphorus in the water (a). Nitrogen, however, is immediately taken up by algae, and no free nitrogen is measured in the coastal waters. The addition of ammonium (NH4) caused heavy phytoplankton growth in bay water, but the addition of phosphate (PO43) did not induce algal growth (b). Ammonium enriched Phytoplankton 30 8 8 Phosphate enriched 7 7 Unenriched control Inorganic phosphorus 24 6 6 Phytoplankton (millions of cells/mL) Inorganic phosphorus (g atoms/L) 5 5 18 4 4 Phytoplankton (millions of cells per mL) 3 3 12 2 2 1 1 6 0 0 2 4 5 11 30 15 19 21 0 Station number Starting algal density 2 4 5 11 30 15 19 21 Great South Bay Moriches Bay Shinnecock Bay Station number (a) Phytoplankton biomass and phosphorus concentration (b) Phytoplankton response to nutrient enrichment Since adding phosphorus, which was already in rich supply, had no effect on Nannochloris growth, whereas adding nitrogen increased algal density dramatically, researchers concluded that nitrogen was the nutrient limiting phytoplankton growth in this ecosystem. CONCLUSION Figure 54.6
Table 54.1 • Experiments in another ocean region • Showed that iron limited primary production
Addition of nutrients to lakes has a wide range of ecological impacts
Figure 54.7 • e.g. sewage runoffeutrophication loss of fish species
EXPERIMENT Over the summer of 1980, researchers added phosphorus to some experimental plots in the salt marsh, nitrogento other plots, and both phosphorus and nitrogen to others. Some plots were left unfertilized as controls. Adding nitrogen (N) boosts net primary production. RESULTS 300 N P 250 200 Live, above-ground biomass (g dry wt/m2) N only 150 100 Control P only 50 0 July August 1980 June Experimental plots receiving just phosphorus (P) do not outproduce the unfertilized control plots. CONCLUSION These nutrient enrichment experiments confirmed that nitrogen was the nutrient limiting plant growth in this salt marsh. Figure 54.9 • Soil nutrients often the limiting factor in primary production (usually nitrogen)
Energy transfer between trophic levels is usually 10% efficient
Plant material eaten by caterpillar 200 J Cellular respiration 67 J 100 J Feces 33 J Growth (new biomass) Figure 54.10 Production Efficiency
Tertiary consumers 10 J Secondary consumers 100 J Primary consumers 1,000 J Primary producers 10,000 J 1,000,000 J of sunlight Figure 54.11 Pyramids of Production
Trophic level Dry weight (g/m2) 21 Primary consumers (zooplankton) Primary producers (phytoplankton) 4 (b) In some aquatic ecosystems, such as the English Channel, a small standing crop of primary producers (phytoplankton)supports a larger standing crop of primary consumers (zooplankton). Figire 54.12b • Certain aquatic ecosystemsh have inverted biomass pyramids
Trophic level Number of individual organisms Tertiary consumers 3 Secondary consumers 354,904 Primary consumers 708,624 Primary producers 5,842,424 Figure 54.13 Pyramids of Numbers
Trophic level Secondary consumers Primary consumers Primary producers • Worldwide agriculture could successfully feed many more people if humans ate only plant material Figure 54.14
Figure 54.15 • Most terrestrial ecosystems • Have large standing crops despite the large numbers of herbivores
The green world hypothesis proposes several factors that keep herbivores in check • Plants have defenses against herbivores • Nutrients, not energy supply, usually limit herbivores • Abiotic factors limit herbivores • Intraspecific competition can limit herbivore numbers • Interspecific interactions check herbivore densities
Life on Earth depends on the recycling of essential chemical elements • Nutrient circuits that cycle matter through an ecosystem • Involve both biotic and abiotic components and are often called biogeochemicalcycles
A General Model of Chemical Cycling • Gaseous forms of carbon, oxygen, sulfur, and nitrogen • Occur in the atmosphere and cycle globally • Less mobile elements, including phosphorous, potassium, and calcium • Cycle on a local level
Reservoir a Reservoir b Organic materials available as nutrients Organic materials unavailable as nutrients Fossilization Living organisms, detritus Coal, oil, peat Respiration, decomposition, excretion Assimilation, photosynthesis Burning of fossil fuels Reservoir d Reservoir c Inorganic materials unavailable as nutrients Inorganic materials available as nutrients Weathering, erosion Atmosphere, soil, water Minerals in rocks Formation of sedimentary rock Figure 54.16 • General model of nutrient cycling
THE CARBON CYCLE THE WATER CYCLE CO2 in atmosphere Transport over land Photosynthesis Solar energy Cellular respiration Net movement of water vapor by wind Precipitation over land Precipitation over ocean Evaporation from ocean Burning of fossil fuels and wood Evapotranspiration from land Higher-level consumers Primary consumers Percolation through soil Carbon compounds in water Detritus Runoff and groundwater Decomposition Figure 54.17 Biogeochemical Cycles • The water cycle and the carbon cycle
Water moves in a global cycle • Driven by solar energy • The carbon cycle • Reflects the reciprocal processes of photosynthesis and cellular respiration
THE PHOSPHORUS CYCLE THE NITROGEN CYCLE N2in atmosphere Rain Plants Weathering of rocks Geologic uplift Runoff Assimilation Denitrifying bacteria Consumption NO3 Nitrogen-fixing bacteria in root nodules of legumes Sedimentation Plant uptake of PO43 Decomposers Nitrifying bacteria Soil Nitrification Leaching Ammonification NO2 NH3 NH4+ Nitrogen-fixing soil bacteria Nitrifying bacteria Decomposition Figure 54.17 • The nitrogen cycle and the phosphorous cycle
Consumers Producers Decomposers Nutrients available to producers Abiotic reservoir Geologic processes Figure 54.18 • Decomposers (detritivores) play a key role in chemical cycling
80.0 Deforested 60.0 40.0 20.0 Nitrate concentration in runoff (mg/L) Completion of tree cutting 4.0 Control 3.0 2.0 1.0 0 1967 1965 1966 1968 (c) The concentration of nitrate in runoff from the deforested watershed was 60 times greater than in a control (unlogged) watershed. Figure 54.19c • Net losses of water and minerals were greater in disturbed area
As the human population has grown in size • Our activities have disrupted the trophic structure, energy flow, and chemical cycling of ecosystems in most parts of the world
Nutrient Enrichment • Transporting nutrients from one location to another & added new materials, some of them toxins, to ecosystems
Figure 54.20 Agriculture and Nitrogen Cycling • Agriculture constantly removes nutrients from ecosystems • That would ordinarily be cycled back into the soil
Nitrogen is the main nutrient lost through agriculture • Thus, agriculture has a great impact on the nitrogen cycle • Industrially produced fertilizer is typically used to replace lost nitrogen • But the effects on an ecosystem can be harmful
Contamination of Aquatic Ecosystems • The critical load for a nutrient • Is the amount of that nutrient that can be absorbed by plants in an ecosystem without damaging it
When excess nutrients are added to an ecosystem, the critical load is exceeded • And the remaining nutrients can contaminate groundwater and freshwater and marine ecosystems
Sewage runoff contaminates freshwater ecosystems • Causing cultural eutrophication, excessive algal growth, which can cause significant harm to these ecosystems
Acid Precipitation • Combustion of fossil fuels is the main cause
4.6 4.3 4.6 4.3 4.6 4.1 4.3 4.6 Europe Figure 54.21 North America • North American and European ecosystems downwind from industrial regionshave been damaged by rain and snow containing nitric and sulfuric acid