Engineering 101 Linking Experiments to Models through the Bridge Design Exercise
320 likes | 445 Views
Engineering 101 Linking Experiments to Models through the Bridge Design Exercise. Prof. Subramaniam (“ Subby ”) D. Rajan, Prof. Narayanan Neithalath and Amie Baisley Graduate Students : Kirk Vance, Matt Aguayo, Tejas Ashani , Joseph Harrington and Canio Hoffarth. What are Experiments?.

Engineering 101 Linking Experiments to Models through the Bridge Design Exercise
E N D
Presentation Transcript
Engineering 101Linking Experiments to Models through the Bridge Design Exercise Prof. Subramaniam (“Subby”) D. Rajan, Prof. Narayanan Neithalath and Amie Baisley Graduate Students: Kirk Vance, Matt Aguayo, TejasAshani, Joseph Harrington and CanioHoffarth
What are Experiments? • Tests to determine the relationship between (input) variables and (output) responses • Example 1: What is the effect of dowel diameter on the weight of the bridge? • Model: The entire bridge system • Input Variable: Dowel diameter • Output Response: Weight of the bridge • Example 2: What is the effect of dowel diameter on the maximum deflection of the bridge deck? • Model: The entire bridge system • Input Variable: Dowel diameter • Output Response: Deflection of the bridge deck at various locations
What are Models? • Relationship between (input) variables and (output) responses • Simple equation • Model described by one or more complex equation(s) – differential equation(s), integral equation(s), … • Example 1: What is the effect of dowel diameter on the weight of the bridge? • Example 2: What is the effect of dowel diameter on the maximum deflection of the bridge deck? • Needs a model whose solution can be described by several linear, algebraic equations
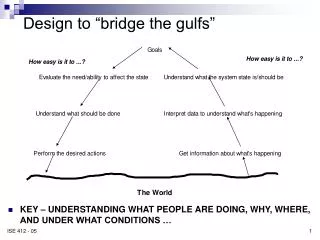
What is a System? • Dictionary definitions • a set of connected things or parts forming a complex whole, in particular • a set of principles or procedures according to which something is done; an organized scheme or method • Traits of a system • has structure, its parts or components are directly or indirectly interact with each other • has behavior (where input and output are linked)
Questions • Q1: Draw a diagram that shows the components of the bridge system, establishes the boundary and identifies the surroundings. • Q2: Describe the bridge system with particular attention to (a) its functionalities, (b) how the different components interact with each other and (c) how the bridge system behaves.
Verification and Validation • Models need to be validated and verified before they can be used with any confidence • Verification: Are you building it right? • Is the theory/principle embodied in the model implemented correctly? g = 9.81 m/s2
Verification and Validation • Validation: Are you building the right thing? • Do the results from the model correlate well with experimental results?
Questions • Q3: Describe what a bridge model could be, by identifying the input variables and output responses. • Q4: Identify the characteristics of each input variable. Describe how you would obtain the values of these variables. • Q5: Identify the characteristics of each output response. What is the purpose of each output response? • Q6: Give examples of engineering processes and products? • Q7: Describe the linkages between experiments and modeling.
Case Study • Develop a model to predict the tip deflection (displacement) of a cantilever beam due to a tip load. Use experiments to validate the model.
Case Study: Basic Steps • Use a sound scientific or engineering principle to develop the model. What parameters will be a part of this model – input and output variables? • Design experiment(s) to verify the model. • Design experiment(s) to validate the model.
Case Study: Principle/Theory • Euler-Bernoulli Beam Theory (w/o derivation) v(x): vertical displacement M(x): Bending moment E(x): Young’s modulus I(x): Moment of inertia L: length of the beam Differential Equation Boundary Conditions
Case Study: Cantilever Beam Integrating twice and using the BCs Boundary Conditions
Case Study: Modulus of Elasticity • What is modulus of elasticity or Young’s modulus (E)? • In a one-dimensional state of stress it is constant of proportionality between the normal stress and the normal strain and has the units of stress. Stress-strain curve (ductile material)
Case Study: Moment of Inertia • What is moment of inertia, I? • The second moment of area (or, moment of inertia) is a measure of a beam’s cross-sectional shape’s resistance to bending.
ExperimentMeasure the width, w, and thickness, t, of a steel plate
Raw Measurement Data Measurements taken at 11 different locations
Raw Measurement Data Histogram Plot
Questions • Q8: What is sample size? • Q9: What is mean? What is another name for mean? • Q10: What is median? • Q11: What is standard deviation? • Q12: Write a few sentences on the quality of the thickness and width data for the steel plate.
Normal Distribution Probability Density Function* Function whose graph is a continuous curve over a range of values that x can take. It has the units of probability rate (not probability). x is called random variable. Area under curve between x1 and x2 gives the probability that x lies in the interval x1 and x2. 6s 68-95-99.7 rule: 1, 2, 3 standard deviations from mean *Excel terminology: Probability Mass Function
Cumulative Distribution Function What is the probability that a random width value is between 1.113 in and 1.114 in?
Questions • Q13: Normal distribution is often called bell curve. Are there other types of distribution? • Q14: Identify and rank the effect of the random variables in the equation for tip deflection.
Experiment 2Measure the tip displacement of an aluminum cantilever beam
Case Study: Model Validation Published Elastic Modulus of Aluminum (6016-T6) = 1.01(107) psi
One-Parameter Regression Analysis • Objective: Use the model and experimental data to determine the Young’s modulus of aluminum.
References • Do an internet search using these keywords – system, model, experiment, verification, validation, statistical quantities. • Engineering Statistics: http://www.itl.nist.gov/div898/handbook/ • http://www.mathsisfun.com/links/curriculum-high-school-statistics.html • http://www.stevespanglerscience.com/lab/experiments • http://en.wikipedia.org/wiki/Verification_and_validation