Download
1 / 26
260 likes | 367 Views
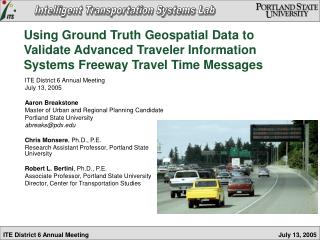
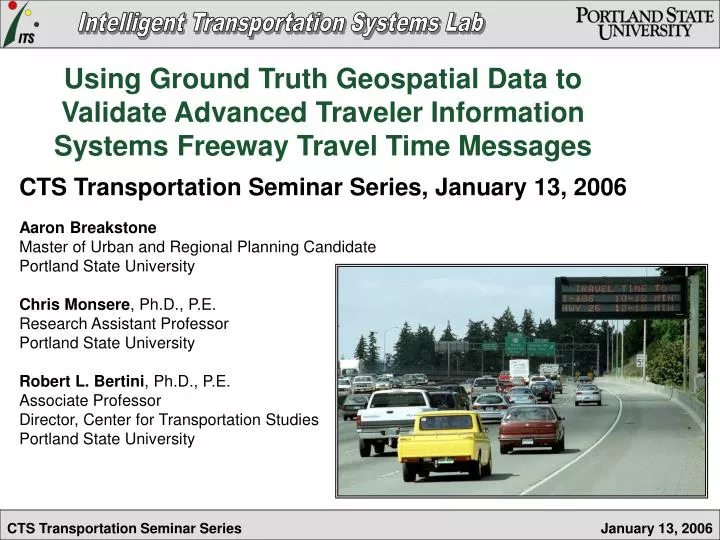
Using Ground Truth Geospatial Data to Validate Advanced Traveler Information Systems Freeway Travel Time Messages. CTS Transportation Seminar Series, January 13, 2006 Aaron Breakstone Master of Urban and Regional Planning Candidate Portland State University Chris Monsere , Ph.D., P.E.

E N D
Using Ground Truth Geospatial Data to Validate Advanced Traveler Information Systems Freeway Travel Time Messages CTS Transportation Seminar Series, January 13, 2006 Aaron Breakstone Master of Urban and Regional Planning Candidate Portland State University Chris Monsere, Ph.D., P.E. Research Assistant Professor Portland State University Robert L. Bertini, Ph.D., P.E. Associate Professor Director, Center for Transportation Studies Portland State University
Outline • Project Overview • Summary of Test Area • Experimental Design • Data Collection • Data Comparison • Results • Next Steps
Outline • Project Overview • Summary of Test Area • Experimental Design • Data Collection • Data Comparison • Results • Next Steps
Project Overview Goals • Evaluate Oregon Department of Transportation (ODOT)’s travel time estimating and reporting capabilities • Identify locations where additional detectors might improve estimates
Project Overview • ODOT Region 1 Traffic Management Operations Center (TMOC) • 485 inductive loop detectors • Advanced Traveler Information Systems (ATIS): www.TripCheck.com • 19 dynamic message signs (DMS) • 3 display travel times
Project Overview Portland Regional Transportation Archive Listing (PORTAL) http://portal.its.pdx.edu • Funded by NSF • Direct fiber-optic connection between ODOT and PSU • 20-second loop detector data • Volume • Speed • Occupancy • Customized travel time area
Outline • Project Overview • Summary of Test Area • Experimental Design • Data Collection • Data Comparison • Results • Next Steps
Summary of Test Area • 15 directional freeway links • I-5 (6) • I-205 (3) • I-84 (2) • US-26 (2) • OR-217 (2) Downtown Portland
Outline • Project Overview • Summary of Test Area • Experimental Design • Data Collection • Data Comparison • Results • Next Steps
Experimental Design • Analysis of PORTAL estimates to determine required number of runs • Data collection plan • 5-10 runs required for most links • 4 routes designed • Transitional periods targeted • Groups with 5-7 minute headways • Standard probe vehicle instructions
Outline • Project Overview • Summary of Test Area • Experimental Design • Data Collection • Data Comparison • Results • Next Steps
Data Collection • Hardware • Palm handheld computers • Magellan GPS devices • Software • ITS-GPS • Free • Available at www.its.pdx.edu • Individual runs and groups of probe vehicles • Variety of traffic conditions
Data Collection • 87 probe vehicle runs • 904 minutes (~15 hours) of collection time • 516 miles of data • 12 drivers • 7 days
Outline • Project Overview • Summary of Test Area • Experimental Design • Data Collection • Data Comparison • Results • Next Steps
Data Comparison • Probe data • Individual runs downloaded • Runs plotted on freeway network map showing link endpoints • Pertinent data segments extracted first point on Link 3 last point on Link 9 last point on Link 2
Data Comparison • Detector data • Assignment of influence areas • Midpoint method • ODOT modified midpoint method • Aggregation • Nearest 20-second interval • e.g. 9:15:34 9:15:20 • Average of nearest interval and 1 minute before • Average of nearest interval and 3 minutes before
Outline • Project Overview • Summary of Test Area • Experimental Design • Data Collection • Data Comparison • Results • Next Steps
Results • ATMS estimates reasonably accurate
Results • ATMS estimates reasonably accurate Probe Vehicle Projected Trajectory Other Projections
~ 2 minutes (4 mi.) } Probe Projection Influence Area Limit } ~ 11 minutes (8 miles) Results • Detector density and location critical
Results • Incidents difficult to capture
Results • No uniform difference between methods • Aggregation improves accuracy (b) Average of previous 1 minute (a) Nearest 20 second estimate (c) Average of 3 previous minutes
Results Candidate locations for increased detection • Recurring congestion • Detector spacing > 1 mile • Hwy 217 NB at MP 3.2 • US-26 EB at MP 70 • US-26 WB at MP 69 • US-26 WB at MP 70 • I-5 NB at MP 298.5 • I-5 SB at MP 306.5 • I-84 EB at MP 2.0
Outline • Project Overview • Summary of Test Area • Experimental Design • Data Collection • Data Comparison • Results • Next Steps
Next Steps • More data • Incidents • Transitions • Different algorithms • Historical data • Other detectors (e.g. Coifman)
Acknowledgements • Oregon Department of Transportation • Stacy Shetler • Galen McGill • Dennis Mitchell • Jack Marchant • Castle Rock Consultants • Dean Deeter • Student drivers